
Tell us anything

An idea, a bug, something you love. We read every note.

⌘↵ to send. The page you're on comes along.

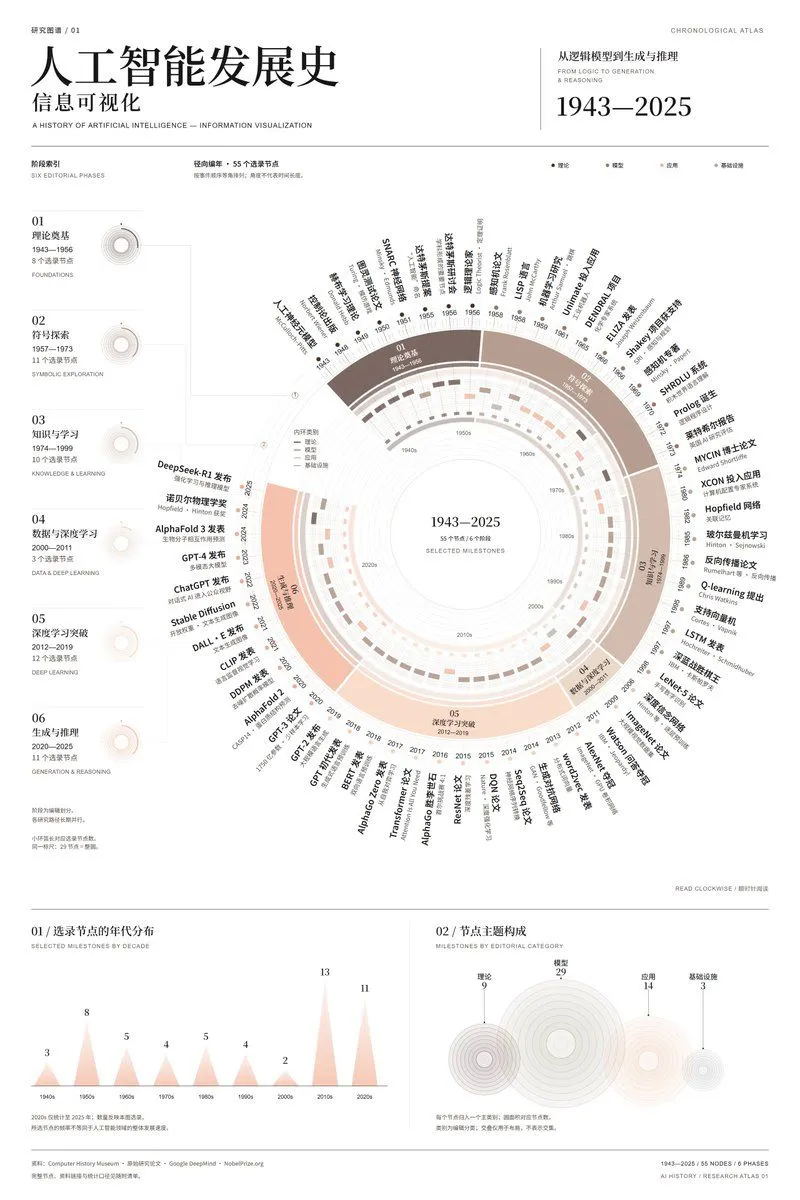
AI History Chronological Atlas Infographic

Made with GPT Image 2.5 in ChatGPT by Library Explainers. Promptclay never generates images.

Did it work?

No reports yet. Tell others if it worked for you.

No comments yet. Be the first.

    AI History Chronological Atlas Infographic

    GPT Image 2.52:3AI-generated

    Prompt

    Goal: Create a sophisticated, high-density chronological atlas infographic visualizing the history of Artificial Intelligence from 1943 to 2025. Canvas: Vertical layout with a clean, academic aesthetic. Background is off-white/light gray. Primary colors are muted earth tones (terracotta, beige, dark brown) and black text. Layout: The design is divided into three main sections: a header, a central radial visualization, and a footer with statistical breakdowns. Header Section: - Top Left: Large Chinese title "人工智能发展史" (History of AI), subtitle "信息可视化" (Information Visualization). English subtext: "A HISTORY OF ARTIFICIAL INTELLIGENCE — INFORMATION VISUALIZATION". - Top Right: A boxed section titled "从逻辑模型到生成与推理" (From Logic Generation & Reasoning) with the date range "1943—2025" in large serif font. - Legend: Small dots indicating categories like Theory, Model, Application, Infrastructure. Central Radial Visualization (The Core): - Structure: A complex concentric circular chart (radial timeline). - Center: Text "1943—2025" and "55 SELECTED MILESTONES". - Rings: Multiple concentric rings representing decades (1940s to 2020s moving outward/inward depending on specific layer logic, but generally chronological flow). - Segments: The circle is divided into 6 colored arcs corresponding to historical phases. Labels for these phases appear on the left side as a vertical list: 1. 理论奠基 (Foundations) 1943-1956 2. 符号探索 (Symbolic Exploration) 1957-1973 3. 知识与学习 (Knowledge & Learning) 1974-1999 4. 数据与深度学习 (Data & Deep Learning) 2000-2011 5. 深度学习突破 (Deep Learning Breakthrough) 2012-2019 6. 生成与推理 (Generation & Reasoning) 2020-2025 - Data Points: Numerous small labels radiating outwards or placed along the rings, citing specific milestones. Examples visible include: "McCulloch-Pitts", "Turing Machine", "Perceptron", "ELIZA", "Expert Systems", "Backpropagation", "AlexNet", "AlphaGo", "Transformer", "GPT-3", "ChatGPT", "Sora". Footer Section: - Bottom Left: Bar chart titled "01 / 选录节点的年代分布" (Selected Milestones by Decade). Shows counts per decade (e.g., 8 in 1950s, 13 in 2010s). - Bottom Right: Bubble/Donut chart titled "02 / 节点主题构成" (Milestones by Editorial Category). Four circles sized by count: Theory (9), Model (29), Application (14), Infrastructure (3). Visual Style: Swiss International Design style. High contrast typography. Use thin lines for connectors. Clean sans-serif fonts for data, serif for titles. Professional, editorial look.

    Works in
    ChatGPT, Gemini
    Status
    Free to copy
    0
    DetailsVersions, settings and questions

    Written for

    What's in the prompt

    Subject
    Model
    GPT Image 2.5

    If your face changes

    keep my face exactly the same

    Questions

    Does this work in the ChatGPT app?
    Yes. Paste the prompt and attach your photo if it uses one.
    It changed my face. What do I do?
    Add "keep my face exactly the same" to the end and run it again.
    Can I use the images I make?
    Check the terms of the app you use. Promptclay never generates images and claims nothing you make.
    Similar prompts

    See more
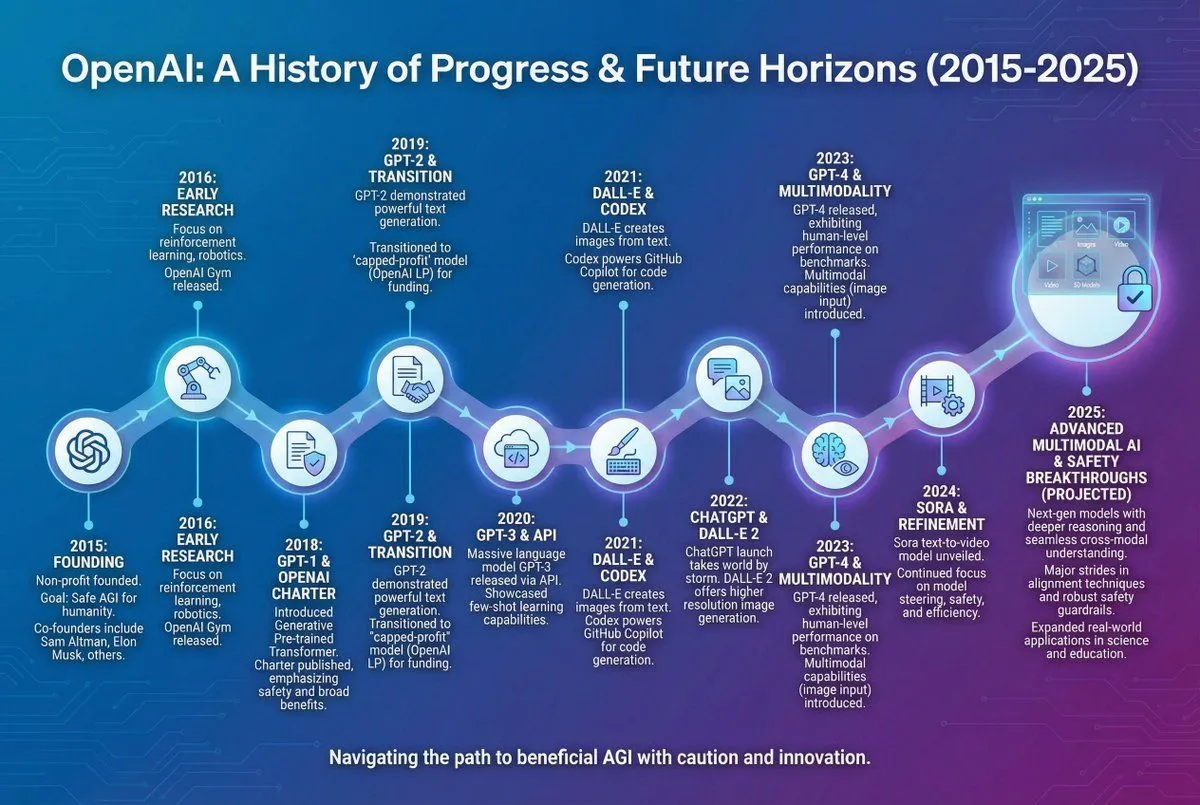
    • Infographic of OpenAI's History
    • Nano Banana Chronology Request (Non-Executable)
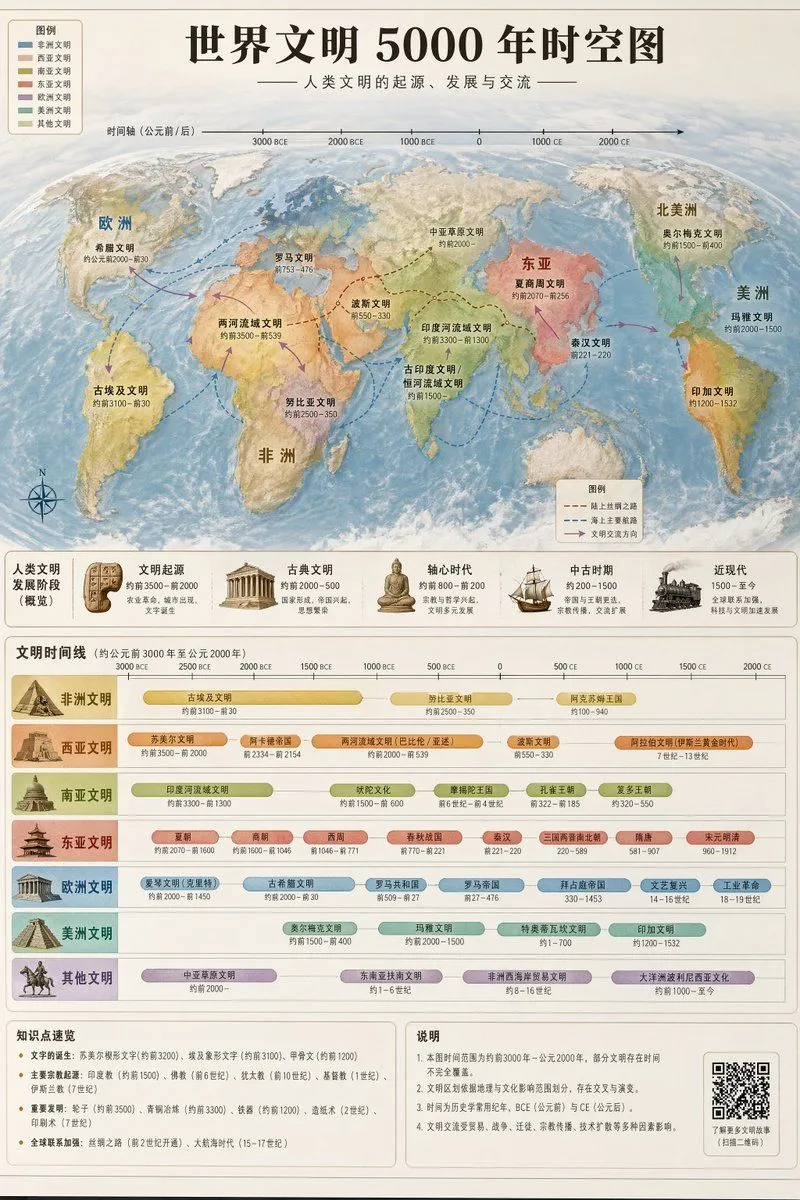
    • World Civilization Spatiotemporal Map
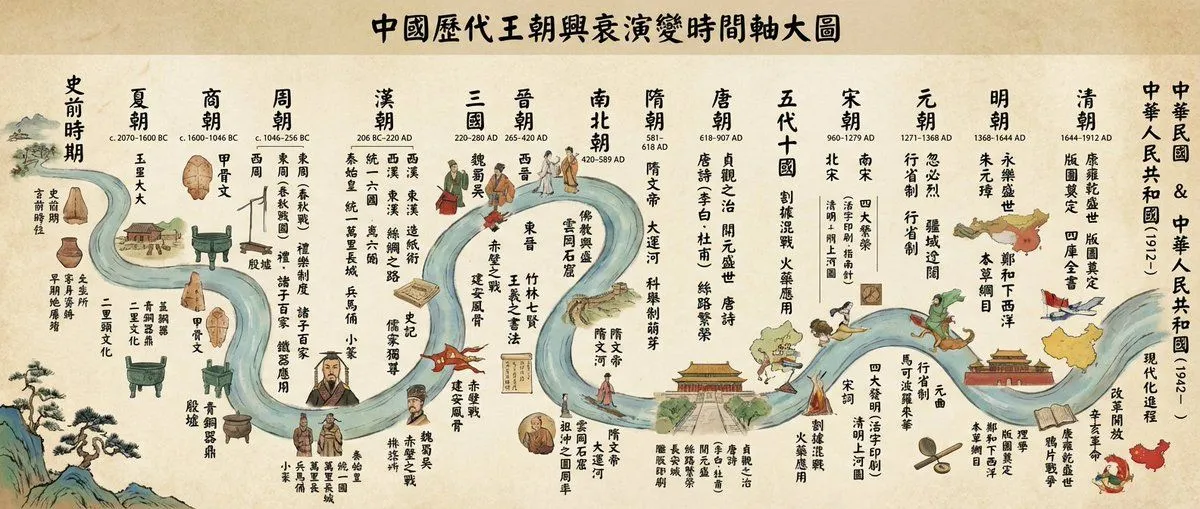
    • Chinese dynasties infographic timeline in traditional Chinese
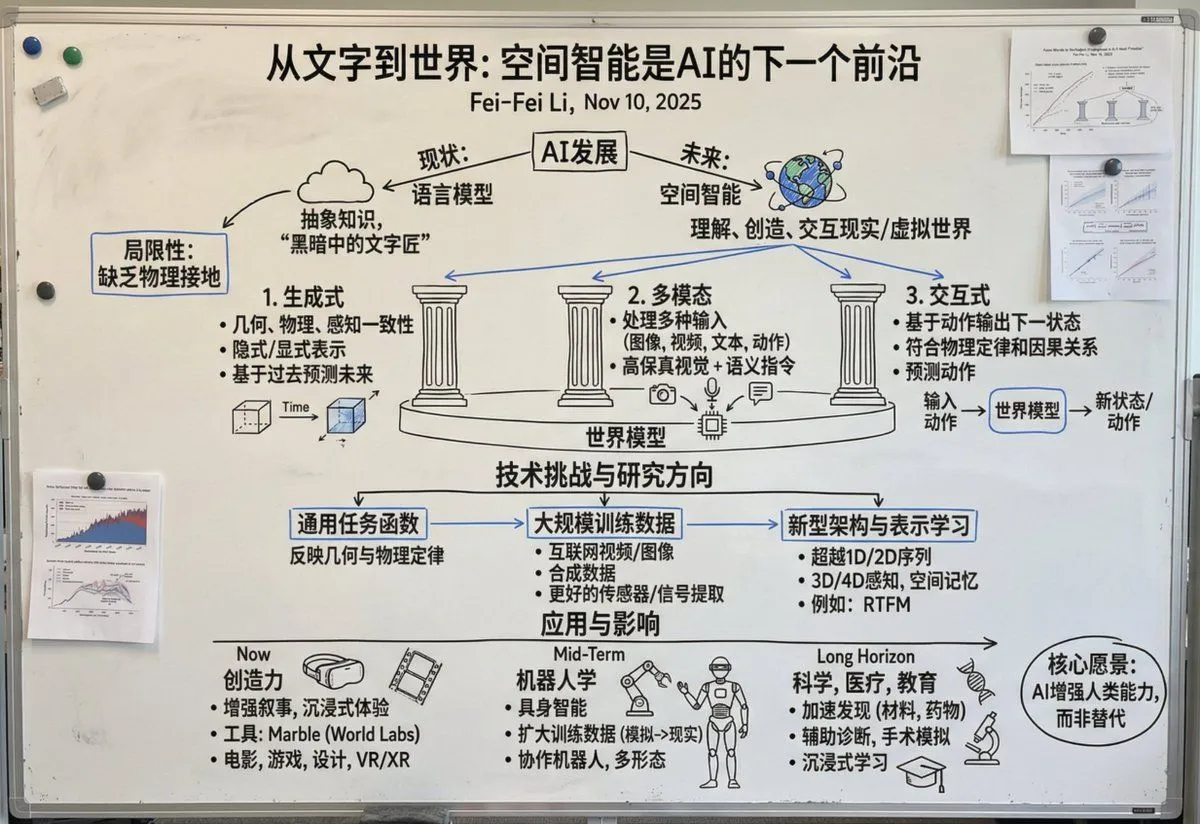
    • Chinese whiteboard summary of long documents
    • Convert Image to Editable PowerPoint Slide Prompt
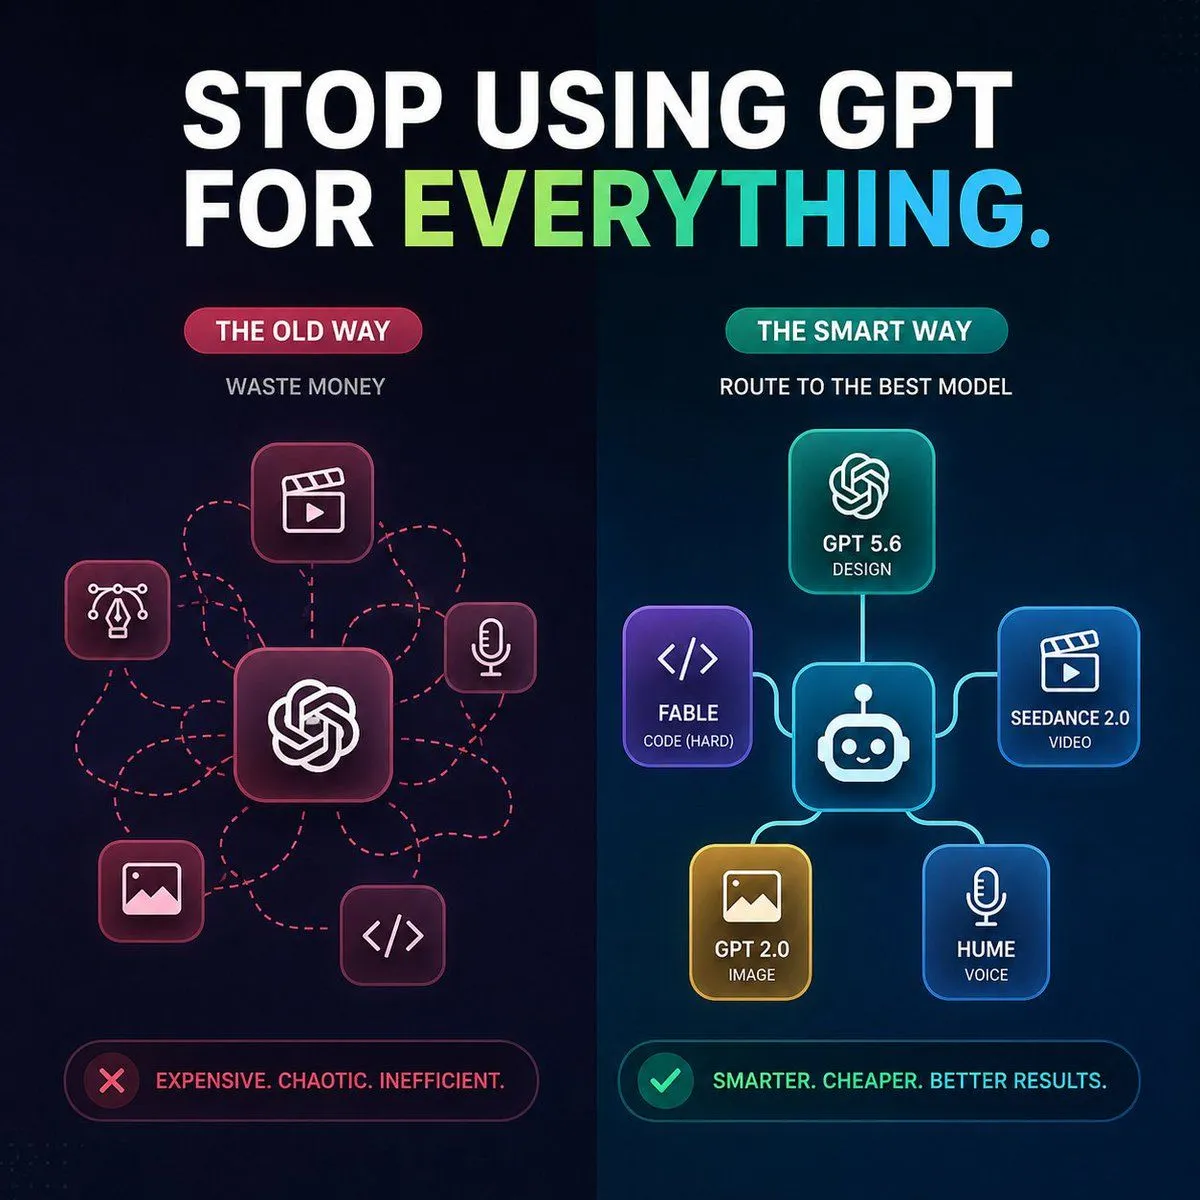
    • AI Model Routing Comparison Infographic
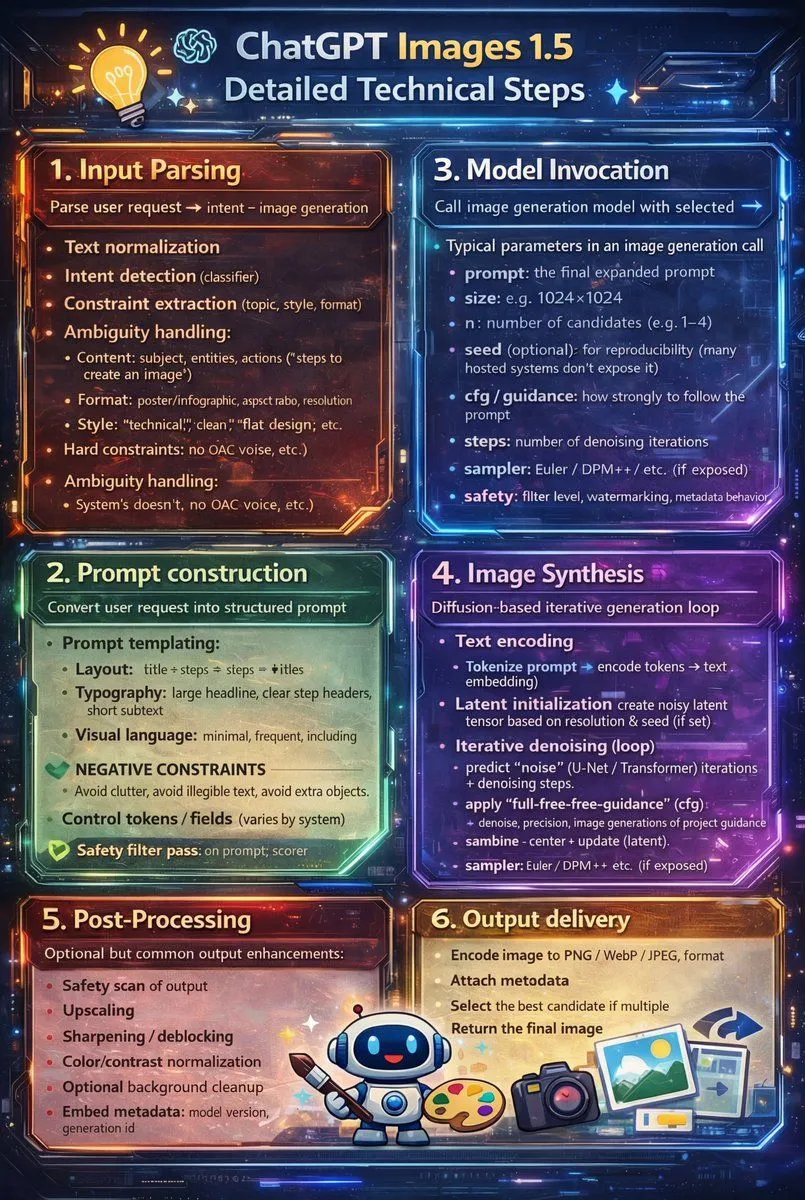
    • Meta-Prompt: Create an Image Detailing its Own Creation Steps
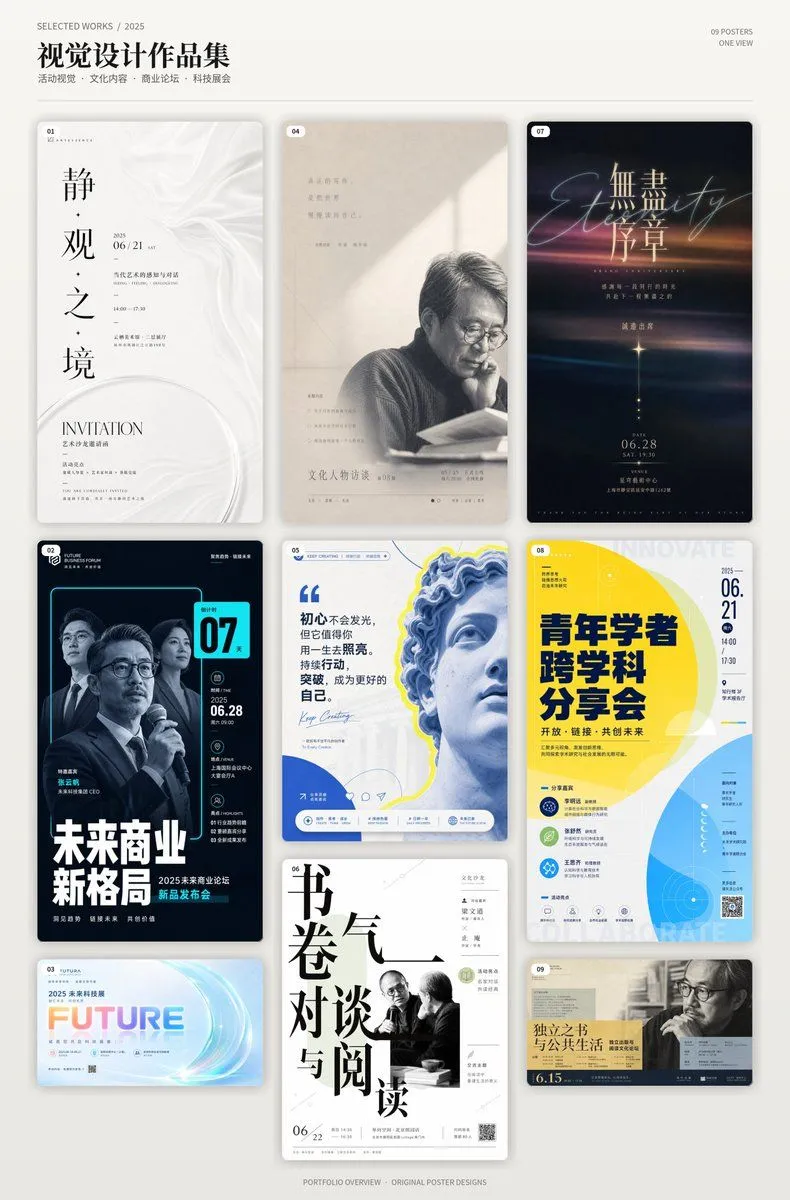
    • Chinese Event Poster Portfolio Board
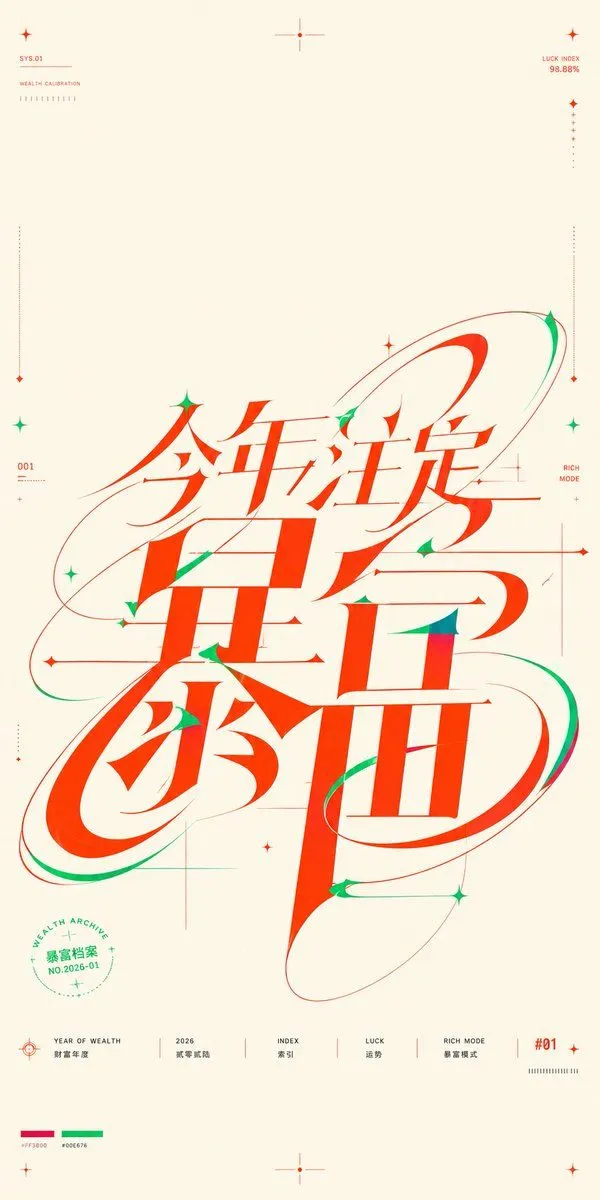
    • Chinese Wealth Typography Poster
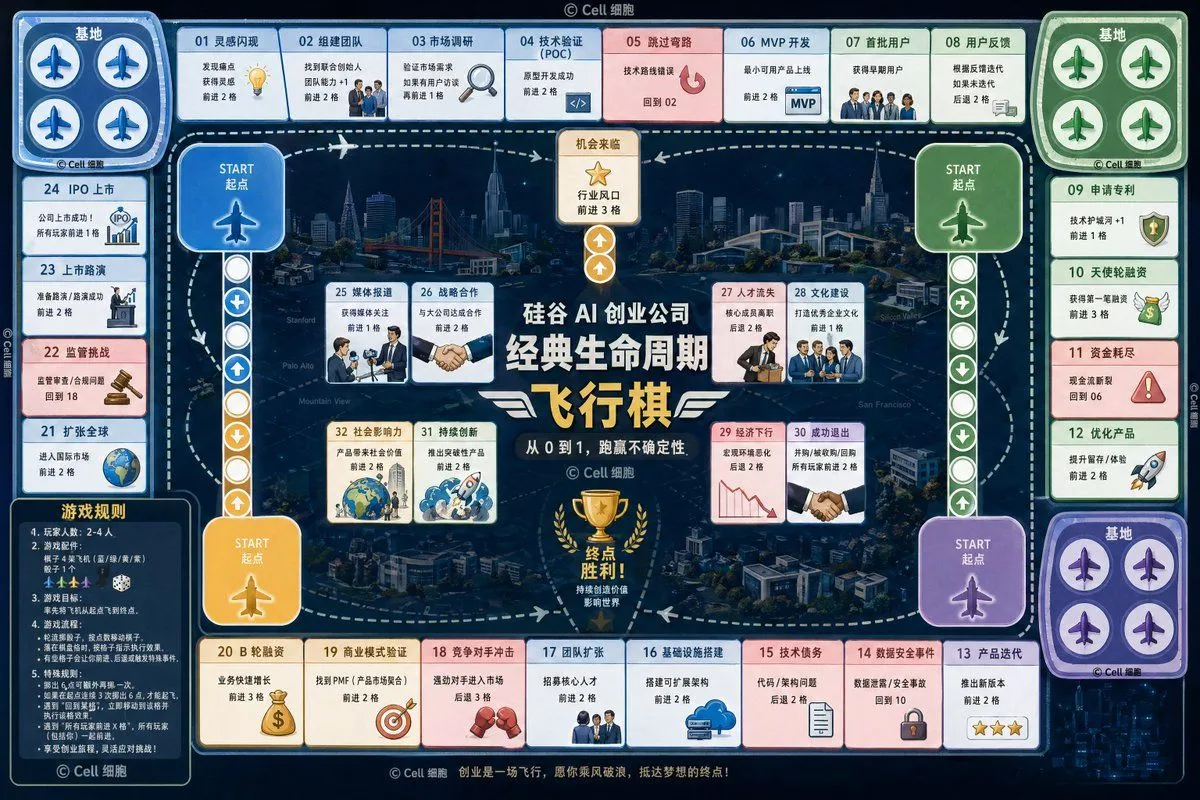
    • AI Startup lifecycle game prompt
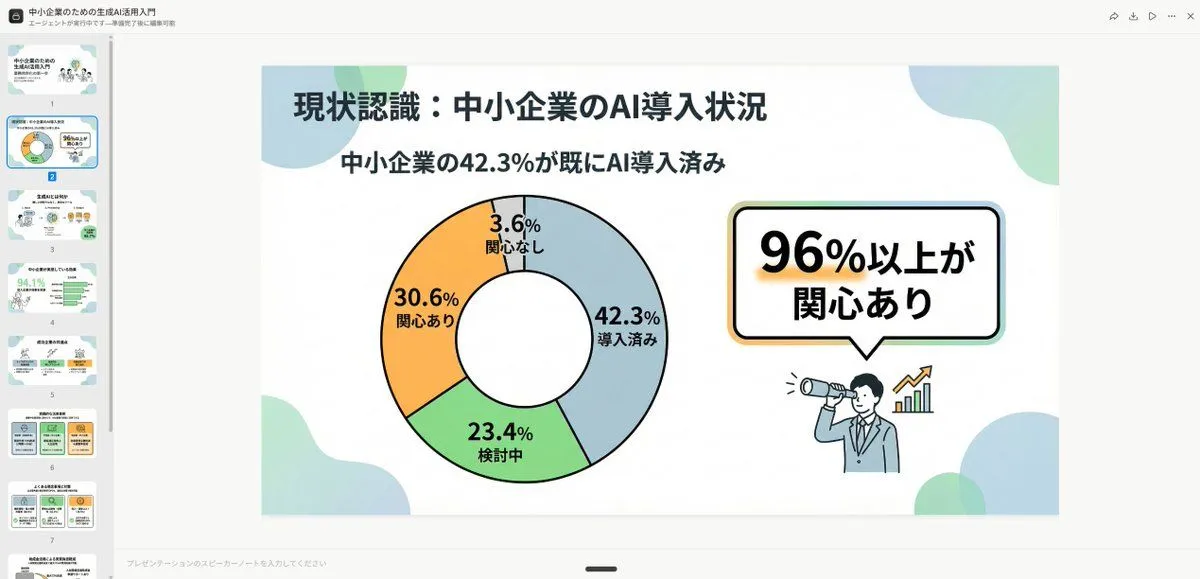
    • High-Quality Flat Design Slide Generation Prompt
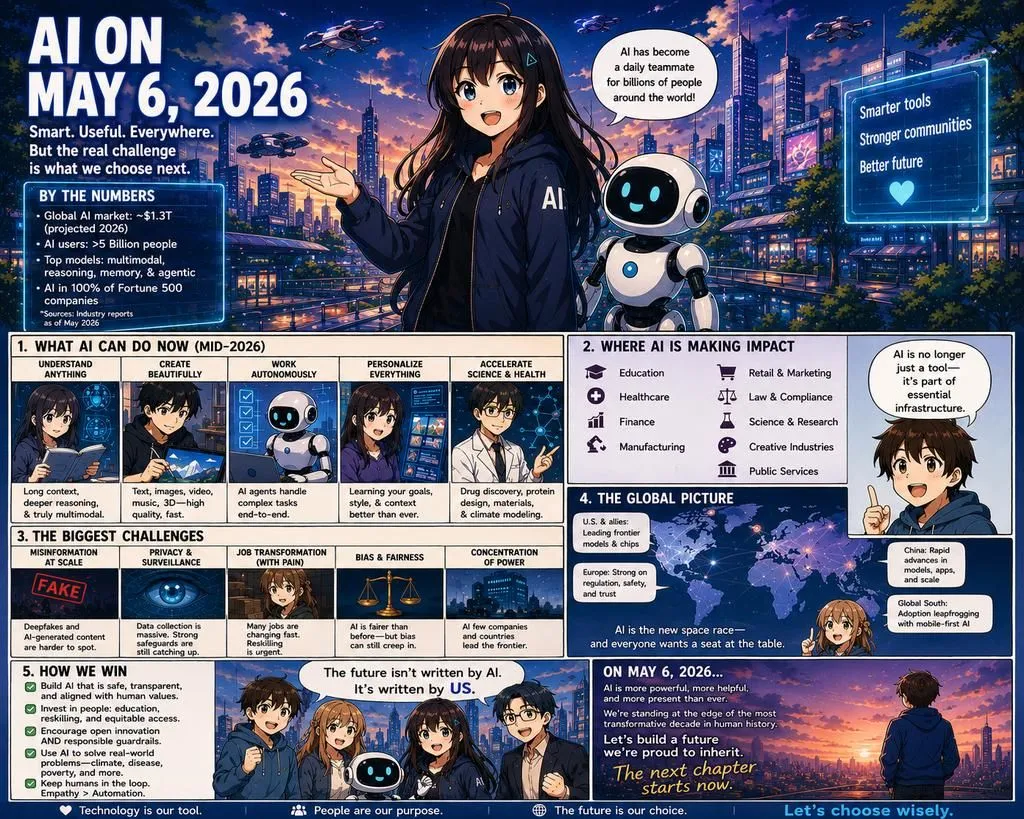
    • Future AI Anime Comic Infographic
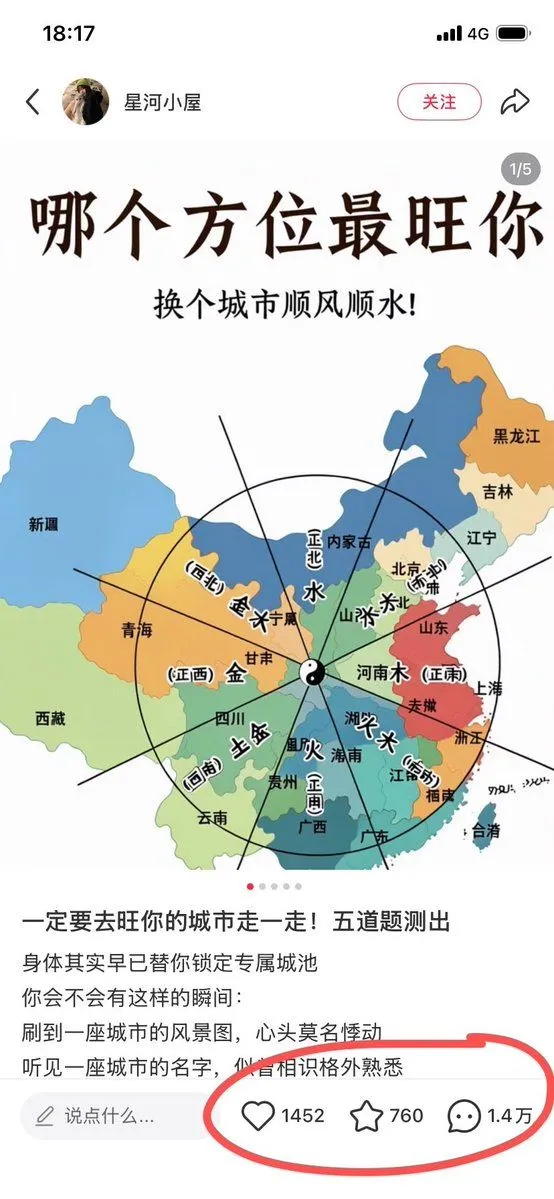
    • Chinese Feng Shui City Test Screenshot
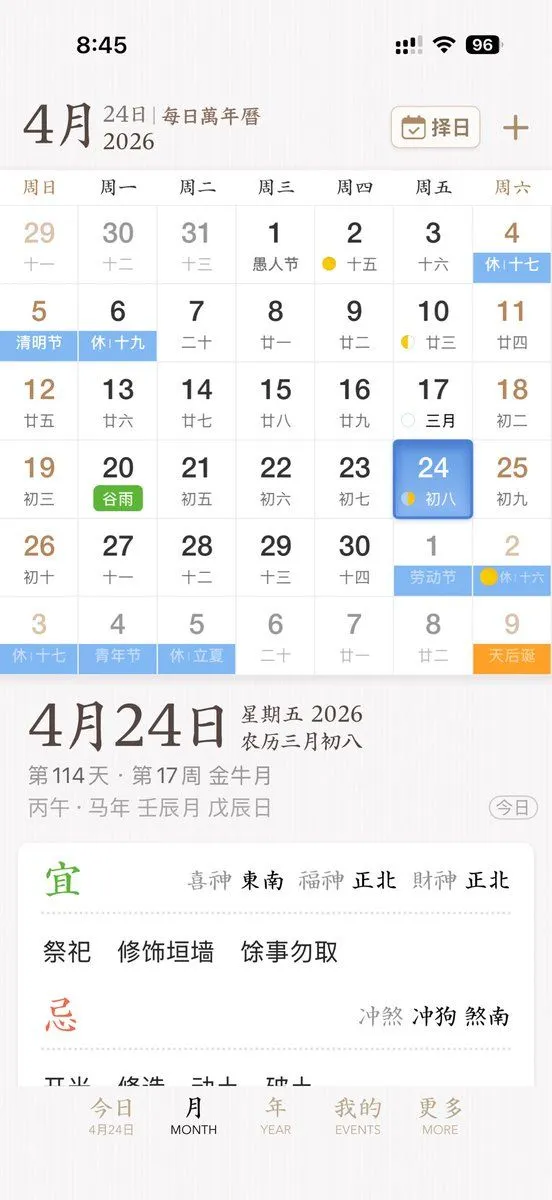
    • Elegant Chinese Calendar App UI
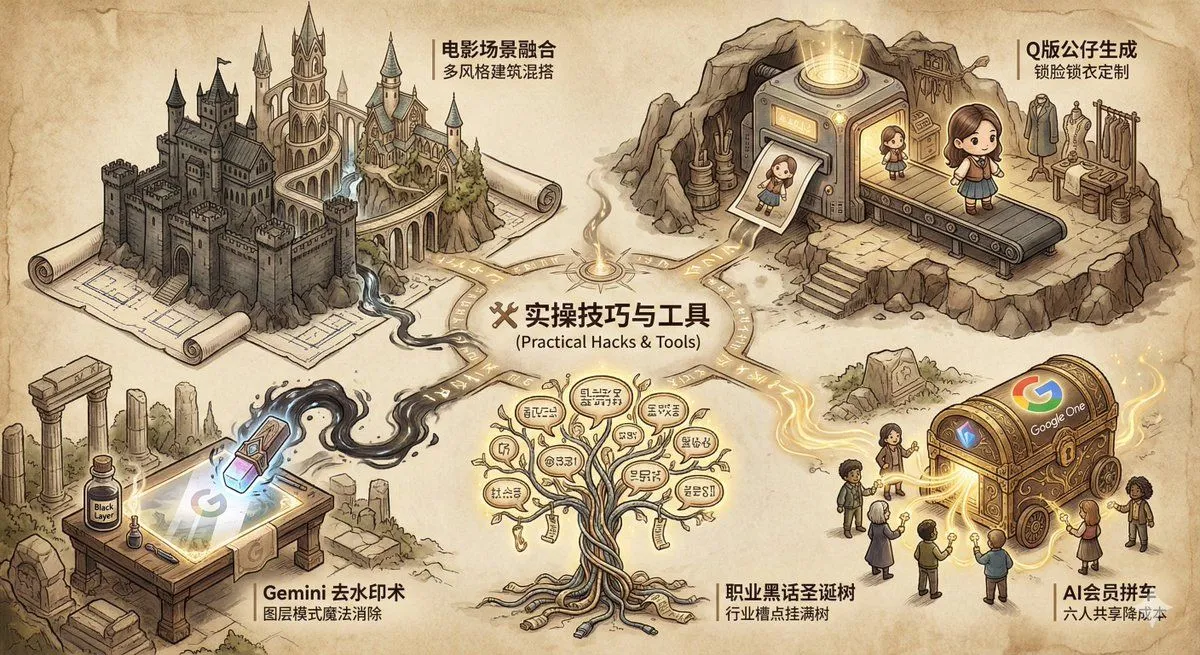
    • Industry Jargon Christmas Tree Prompt
    • ASCII Layout Landing Page Generator
    • Minimal GPT Image 2 Logo Lockup
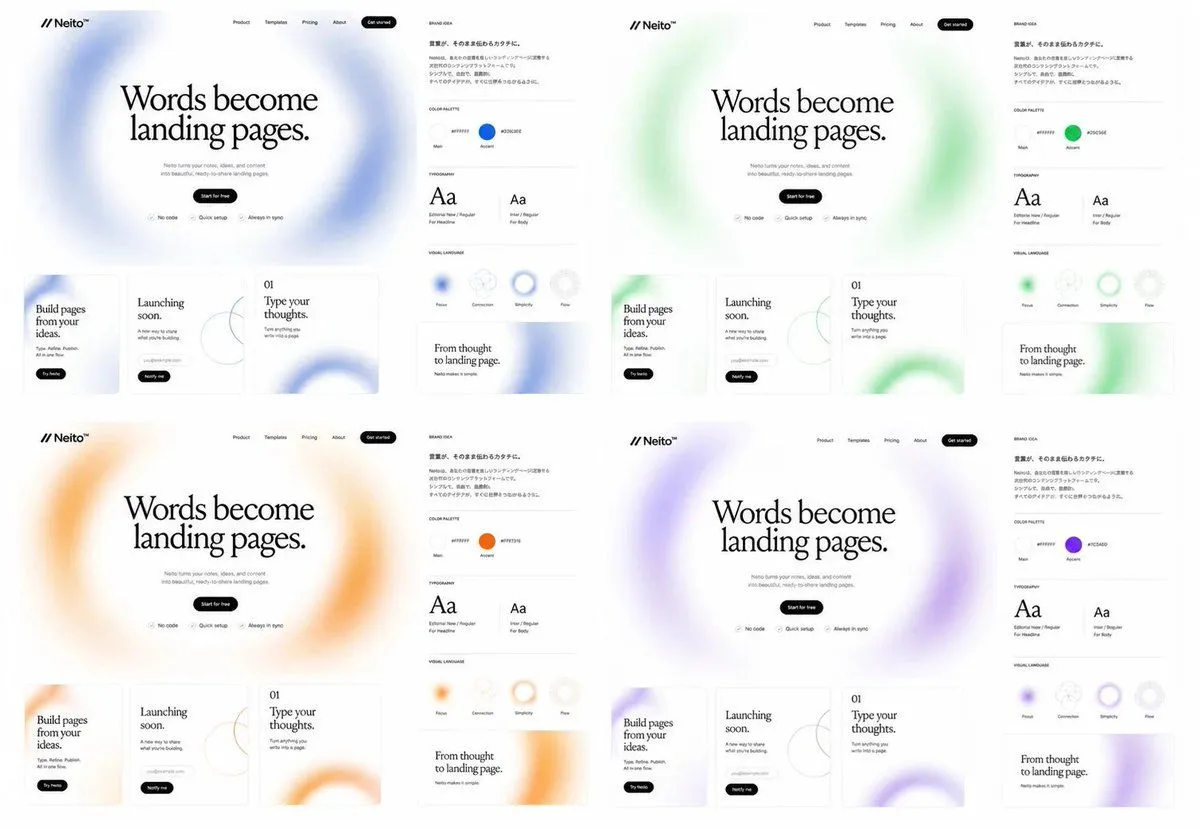
    • Neito Brand Color Exploration Board
    • Tech Tutorial Thumbnail with UI Mockup
    • Cyberpunk Flash Sale Landing Hero
    • Japanese AI Telop Thumbnail
    • Mechanical Keyboard Product Page Mockup
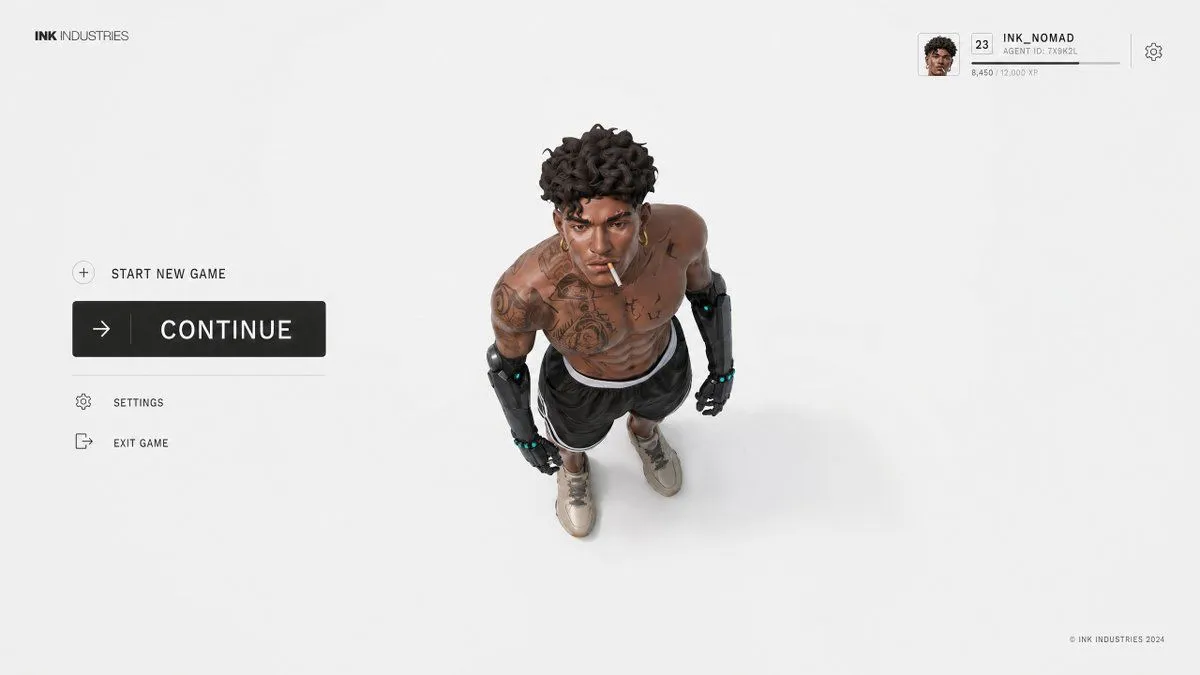
    • Video Game Lobby Interface Prompt

    Show more

    Run it on your phone

    1. Prompt copiedRead it

      Goal: Create a sophisticated, high-density chronological atlas infographic visualizing the history of Artificial Intelligence from 1943 to 2025. Canvas: Vertical layout with a clean, academic aesthetic. Background is off-white/light gray. Primary colors are muted earth tones (terracotta, beige, dark brown) and black text. Layout: The design is divided into three main sections: a header, a central radial visualization, and a footer with statistical breakdowns. Header Section: - Top Left: Large Chinese title "人工智能发展史" (History of AI), subtitle "信息可视化" (Information Visualization). English subtext: "A HISTORY OF ARTIFICIAL INTELLIGENCE — INFORMATION VISUALIZATION". - Top Right: A boxed section titled "从逻辑模型到生成与推理" (From Logic Generation & Reasoning) with the date range "1943—2025" in large serif font. - Legend: Small dots indicating categories like Theory, Model, Application, Infrastructure. Central Radial Visualization (The Core): - Structure: A complex concentric circular chart (radial timeline). - Center: Text "1943—2025" and "55 SELECTED MILESTONES". - Rings: Multiple concentric rings representing decades (1940s to 2020s moving outward/inward depending on specific layer logic, but generally chronological flow). - Segments: The circle is divided into 6 colored arcs corresponding to historical phases. Labels for these phases appear on the left side as a vertical list: 1. 理论奠基 (Foundations) 1943-1956 2. 符号探索 (Symbolic Exploration) 1957-1973 3. 知识与学习 (Knowledge & Learning) 1974-1999 4. 数据与深度学习 (Data & Deep Learning) 2000-2011 5. 深度学习突破 (Deep Learning Breakthrough) 2012-2019 6. 生成与推理 (Generation & Reasoning) 2020-2025 - Data Points: Numerous small labels radiating outwards or placed along the rings, citing specific milestones. Examples visible include: "McCulloch-Pitts", "Turing Machine", "Perceptron", "ELIZA", "Expert Systems", "Backpropagation", "AlexNet", "AlphaGo", "Transformer", "GPT-3", "ChatGPT", "Sora". Footer Section: - Bottom Left: Bar chart titled "01 / 选录节点的年代分布" (Selected Milestones by Decade). Shows counts per decade (e.g., 8 in 1950s, 13 in 2010s). - Bottom Right: Bubble/Donut chart titled "02 / 节点主题构成" (Milestones by Editorial Category). Four circles sized by count: Theory (9), Model (29), Application (14), Infrastructure (3). Visual Style: Swiss International Design style. High contrast typography. Use thin lines for connectors. Clean sans-serif fonts for data, serif for titles. Professional, editorial look.

    2. Open your app

      This prompt is long, so it is copied instead of sent in the link. Paste it in the app.

    3. Paste and run

      Press and hold the message box, then tap Paste. Add your photo first if the prompt uses one. You may need to sign in.

    AI History Chronological Atlas Infographic