Meteorology Diagrams
Library Explainers
1 hour ago
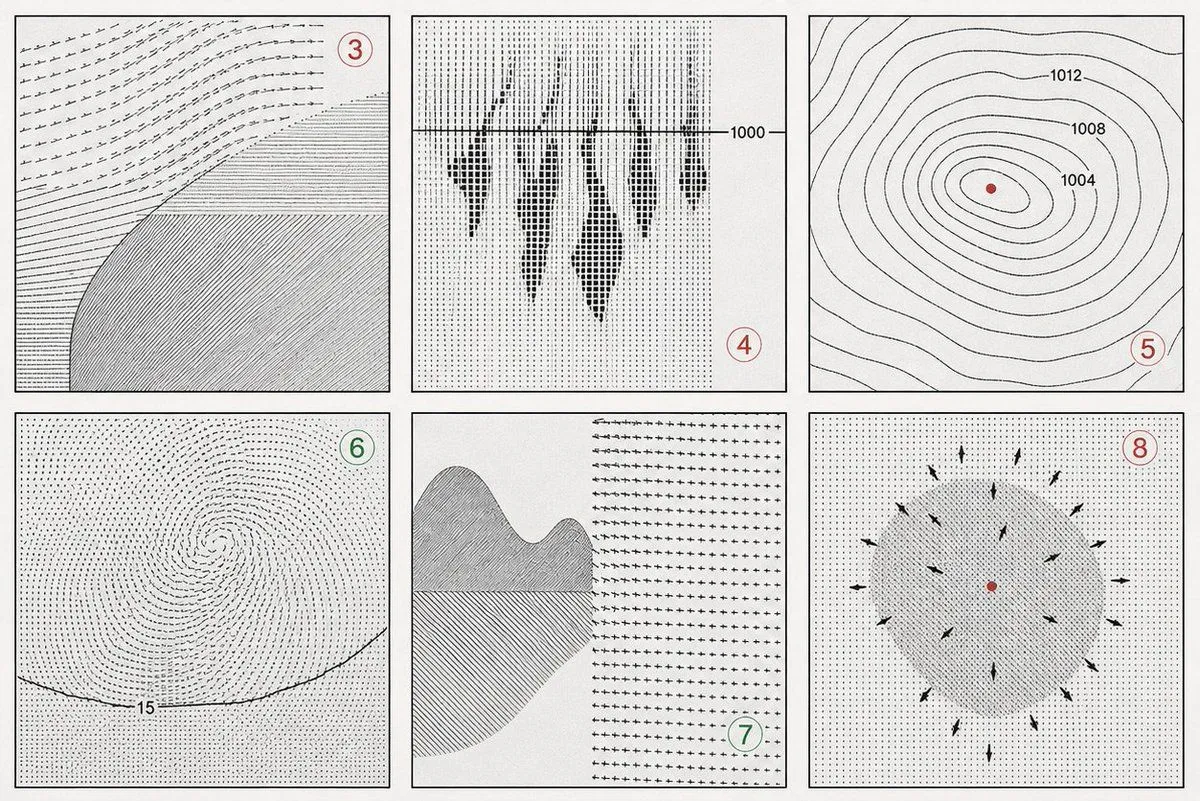
A grid of six scientific diagrams illustrating meteorological phenomena. Top-left: a weather map with isobars and wind barbs, labeled '3'. Top-middle: a cross-section diagram showing vertical air currents, labeled '4' with an altitude marker '1000'. Top-right: concentric isobars around a low-pressure center, labeled '5' with pressure readings '1012', '1008', '1004'. Bottom-left: a spiral pattern representing cyclonic flow, labeled '6' with a temperature reading '15'. Bottom-middle: a terrain profile with airflow vectors over a mountain, labeled '7'. Bottom-right: a radial vector field indicating outward flow from a central point, labeled '8'. The style is technical, monochromatic line art typical of mid-20th-century educational textbooks.