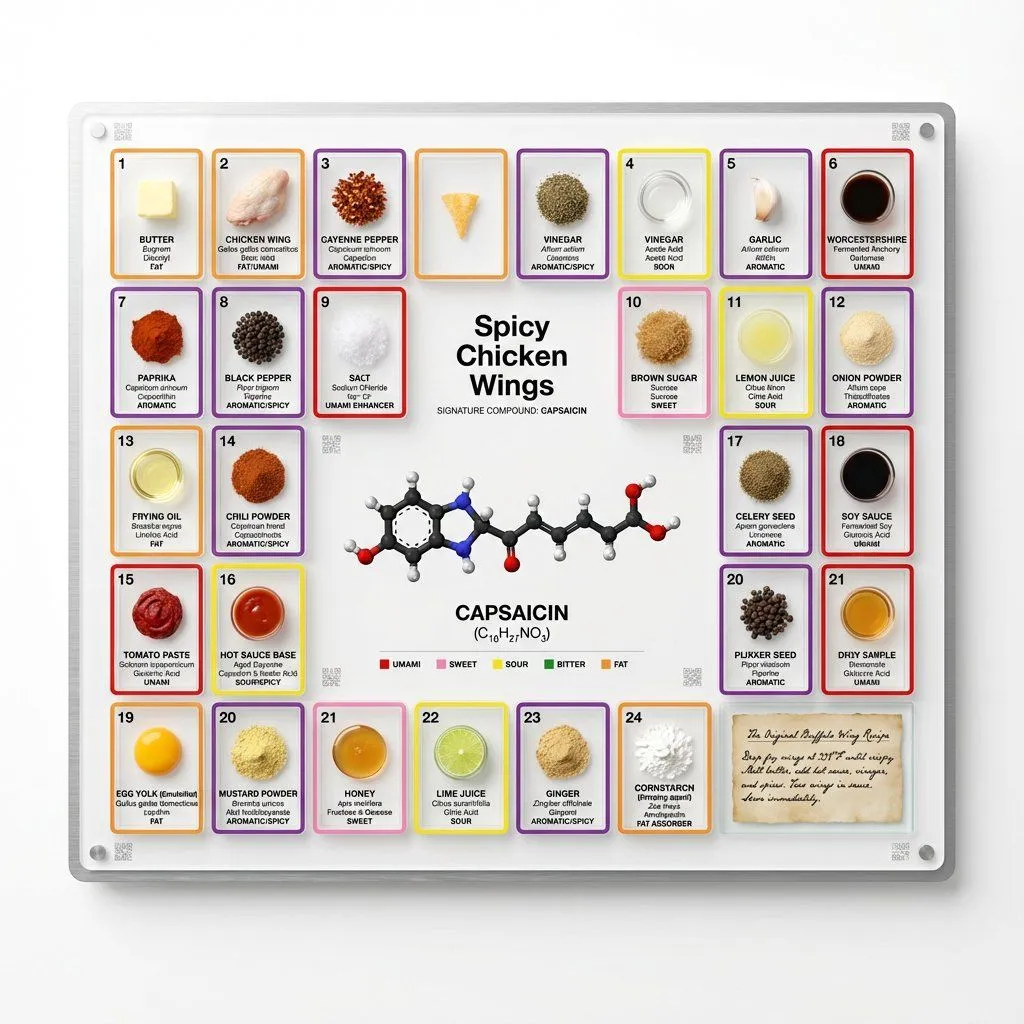
Food Analysis Periodic Table Display Board
<instruction> Input A is a famous dish (photo or dish name). Analyze the dish's complete ingredient breakdown, primary flavor compounds, chemical interactions, and scientific basis for why ingredients work together. Optional Input B is a style reference (laboratory equipment / tech product packaging). If missing, choose scientific periodic table meets Apple product design aesthetic. Goal: Grid-format display board (20"x16") in periodic table structure, with each ingredient in its own compartment labeled with both culinary and scientific information, color-coded by flavor profile. Rules: Brushed aluminum, white acrylic, or frosted glass backing 20-30 small clear compartments in periodic table grid layout Each compartment contains: ingredient specimen, common name, scientific name, primary flavor molecule Color-coded borders: umami (red), sweet (pink), sour (yellow), bitter (green), fat (orange), aromatic (purple) Center "legend" section: 3D molecular structure diagram of signature compound Lower corner: actual handwritten recipe on aged vellum or parchment under glass AR markers for scanning to see animated 3D molecule models Clean sans-serif typography (like Helvetica or Futura) Minimal design with generous white space Include atomic-style "numbers" for each ingredient showing ratio/importance Output: ONE image, 4:5 clean product photography style with soft shadows on pure white background </instruction>