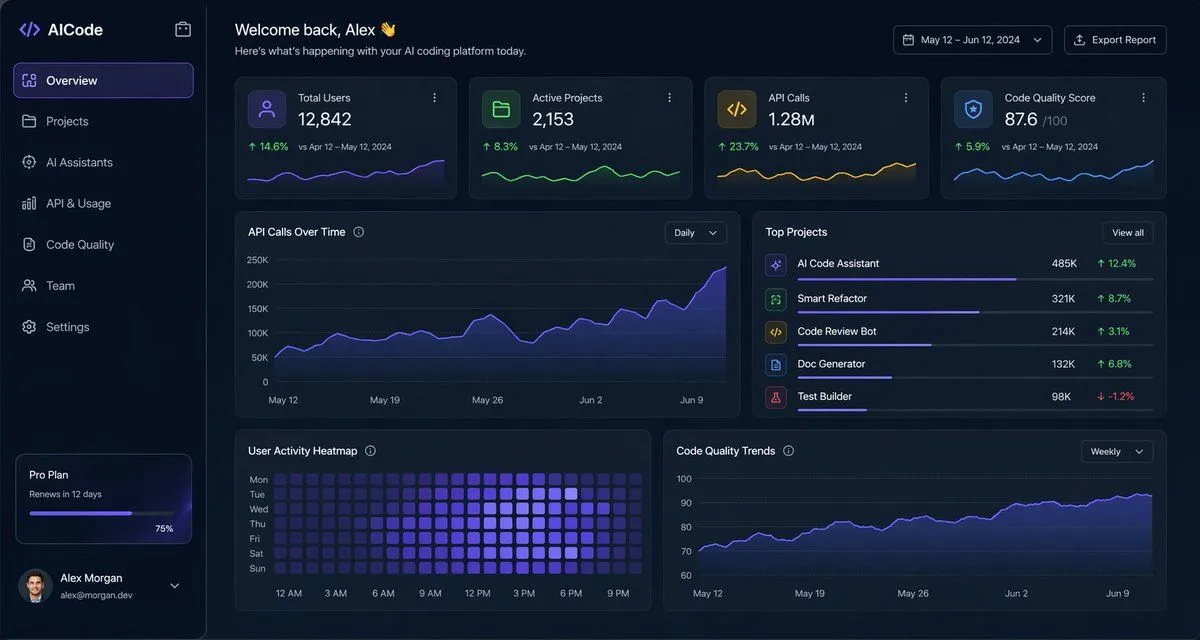
Dark AI Coding Dashboard UI
"type": "dark SaaS analytics dashboard UI", "product": "brand": "argument name=\"brand name\" default=\"AICode\"", "theme": "dark navy blue glassmorphism interface with subtle gradients, soft glow, rounded cards, thin borders, modern developer-tool aesthetic" , "canvas": "aspect_ratio": "16:9", "background": "deep midnight blue with faint vignette and soft radial lighting" , "layout": "structure": "left sidebar plus main content area", "sections": [ "title": "Sidebar", "position": "left", "count": 8, "labels": ["AICode", "Overview", "Projects", "AI Assistants", "API & Usage", "Code Quality", "Team", "Settings"], "details": "logo at top, Overview selected with purple highlight, lower subscription card showing Pro Plan, renews in 12 days, horizontal progress bar at 75%, user profile at bottom with avatar, argument name=\"user name\" default=\"Alex Morgan\", and email alex@morgan.dev" , "title": "Header", "position": "top main area", "count": 4, "labels": ["Welcome back, Alex 👋", "Here's what's happening with your AI coding platform today.", "May 12 – Jun 12, 2024", "Export Report"], "details": "large greeting on left, date range picker and export button on right" , "title": "Metric cards", "position": "top row under header", "count": 4, "labels": ["Total Users", "Active Projects", "API Calls", "Code Quality Score"], "values": ["12,842", "2,153", "1.28M", "876"], "details": "each card has a small colored icon, large main value, comparison text vs Apr 12 – May 12, 2024, positive change percentages 14.6%, 8.3%, 23.7%, 5.9%, and a miniature line chart at the bottom; colors are purple, green, amber, and blue" , "title": "Main analytics panels", "position": "middle and bottom rows", "count": 4, "labels": ["API Calls Over Time", "Top Projects", "User Activity Heatmap", "Code Quality Trends"], "details": "API Calls Over Time is a wide area chart with Daily dropdown and rising purple line ending near 250K; Top Projects is a ranked list of 5 items with progress bars and percentage changes; User Activity Heatmap is a 7-row weekly heatmap with hour labels from 12 AM to 9 PM; Code Quality Trends is a line chart with Weekly dropdown and smooth upward purple trend from about 70 to low 90s" , "title": "Top Projects list", "position": "middle right panel", "count": 5, "labels": ["AI Code Assistant", "Smart Refactor", "Code Review Bot", "Doc Generator", "Test Builder"], "values": ["485K", "321K", "214K", "132K", "98K"], "details": "green positive deltas for first four items 12.4%, 8.7%, 3.1%, 6.8%, and red negative delta -1.2% for Test Builder; each row has a colored square icon and thin horizontal progress bar" ] , "style": "visual_language": "premium fintech and AI product design mockup", "rendering": "crisp high-fidelity UI mockup, subtle shadows, neon edge lighting, polished charts, clean sans-serif typography", "primary_accent": "argument name=\"accent color\" default=\"electric purple\"", "secondary_accents": ["emerald green", "amber yellow", "cyan blue"], "density": "information-rich but spacious, balanced grid, highly legible"