Cartographer's Crisis Board Visualization
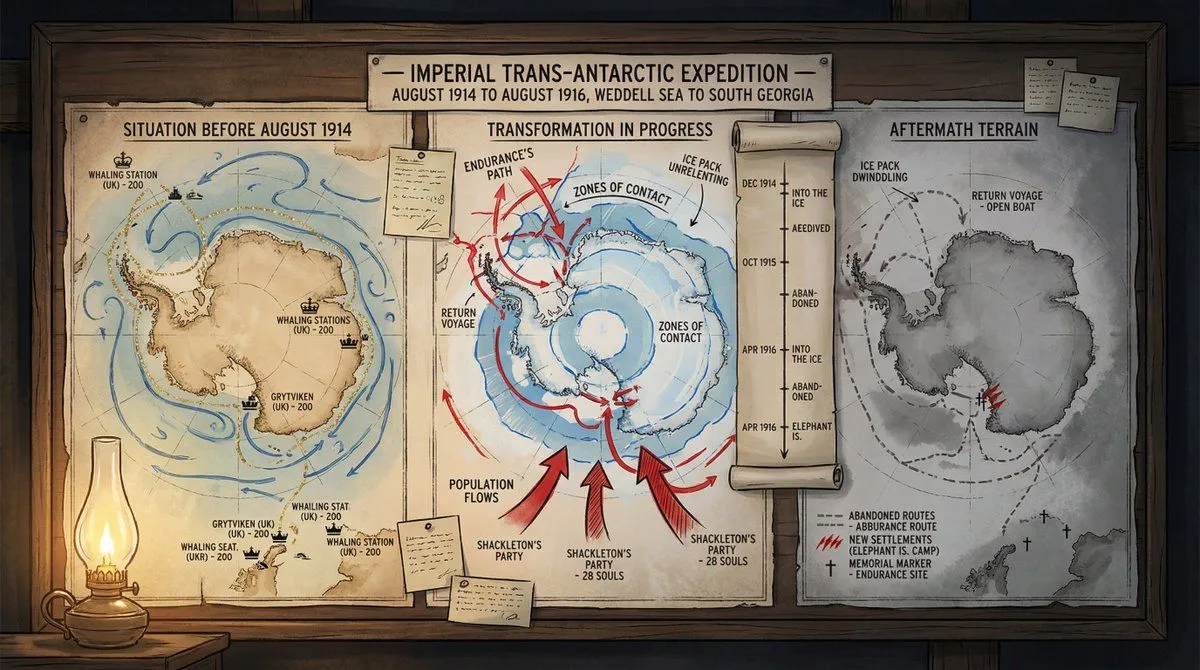
A cartographer's crisis board mapping event_type — time_and_place. Left section: the situation before—peaceful topography, trade routes in gold, settlements marked with period-appropriate symbols, populations annotated. Center section: the transformation in progress—arrows of movement, zones of contact marked in graduated intensity, timeline running vertically with key dates as waypoints, casualty figures or population shifts visualized as proportional flows. Right section: the aftermath terrain—changed borders, abandoned routes, new settlements, memorial markers, the landscape bearing scars of what passed through it. Visual style transitions from pastoral survey calm through urgent wartime graphics to melancholic documentary. Hand-lettered annotations throughout. Title block reading "event_name — [START DATE] TO [END DATE], [GEOGRAPHIC SCOPE]".