
Tell us anything

An idea, a bug, something you love. We read every note.

⌘↵ to send. The page you're on comes along.

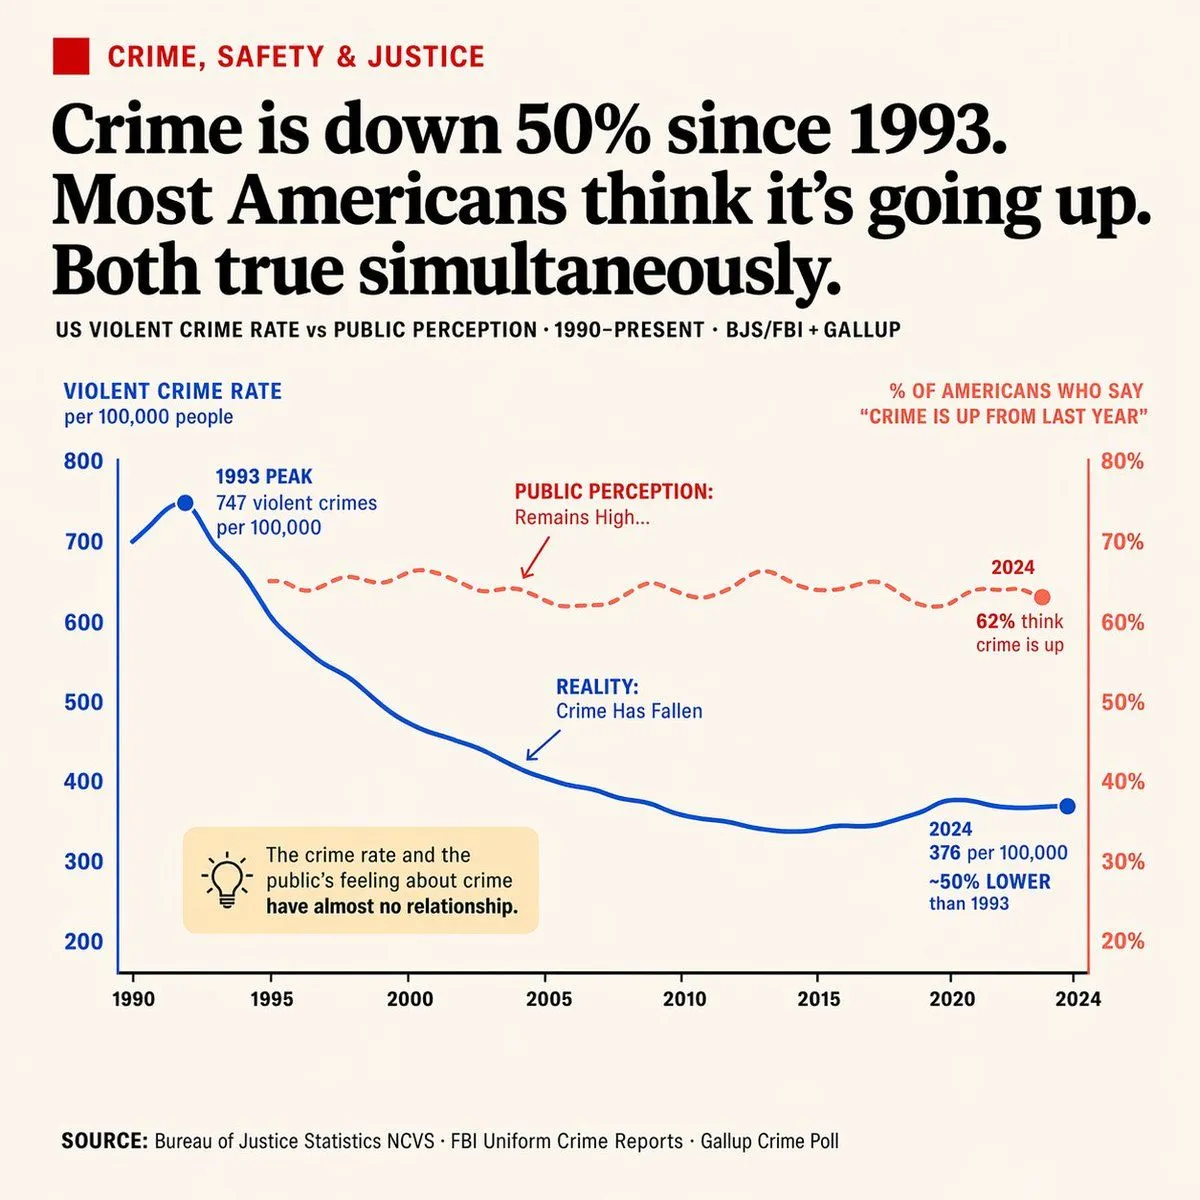
Editorial Dual-Axis Data Infographic

Made with GPT Image 2 in ChatGPT by Library Explainers. Promptclay never generates images.

Did it work?

No reports yet. Tell others if it worked for you.

No comments yet. Be the first.

    Editorial Dual-Axis Data Infographic

    GPT Image 21:1AI-generated

    Prompt

    { "type": "editorial infographic dual-axis line chart", "style": "clean, newspaper-style, off-white background, highly legible typography", "header": { "category": "CRIME, SAFETY & JUSTICE (red text with red square icon)", "headline": "{argument name=\"main headline\" default=\"Crime is down 50% since 1993. Most Americans think it's going up. Both true simultaneously.\"}", "sub_headline": "US VIOLENT CRIME RATE vs PUBLIC PERCEPTION · 1990-PRESENT · BJS/FBI + GALLUP" }, "chart": { "x_axis": "Years 1990 to 2024 with 8 tick marks", "left_y_axis": { "color": "blue", "label": "{argument name=\"left axis label\" default=\"VIOLENT CRIME RATE per 100,000 people\"}", "range": "200 to 800" }, "right_y_axis": { "color": "red", "label": "{argument name=\"right axis label\" default=\"% OF AMERICANS WHO SAY 'CRIME IS UP FROM LAST YEAR'\"}", "range": "20% to 80%" }, "data_series": [ { "name": "Reality", "style": "solid blue line", "trend": "peaks early then drops significantly", "annotations": [ "1993 PEAK 747 violent crimes per 100,000 (with blue dot)", "REALITY: Crime Has Fallen (with blue arrow pointing to line)", "2024 376 per 100,000 ~50% LOWER than 1993 (with blue dot)" ] }, { "name": "Public Perception", "style": "dashed red line", "trend": "remains relatively flat and high", "annotations": [ "PUBLIC PERCEPTION: Remains High... (with red arrow pointing to line)", "2024 62% think crime is up (with red dot)" ] } ] }, "callout_box": { "position": "bottom left inside chart area", "style": "light yellow rectangle", "icon": "lightbulb", "text": "{argument name=\"callout text\" default=\"The crime rate and the public's feeling about crime have almost no relationship.\"}" }, "footer": { "text": "SOURCE: {argument name=\"footer source\" default=\"Bureau of Justice Statistics NCVS · FBI Uniform Crime Reports · Gallup Crime Poll\"}" } }

    Works in
    ChatGPT, Gemini
    Status
    Free to copy
    0
    DetailsVersions, settings and questions

    Written for

    What's in the prompt

    Subject
    Model
    GPT Image 2

    If your face changes

    keep my face exactly the same

    Questions

    Does this work in the ChatGPT app?
    Yes. Paste the prompt and attach your photo if it uses one.
    It changed my face. What do I do?
    Add "keep my face exactly the same" to the end and run it again.
    Can I use the images I make?
    Check the terms of the app you use. Promptclay never generates images and claims nothing you make.
    Similar prompts

    See more
    • Academic Economics Chart Simulation
    • Data Visualization Based on Storytelling with Data Principles
    • Macroeconomic Outlook Prompt (Inflation and Economic Activity)
    • WSJ-Style Business Newspaper Front Page
    • World Model Meme Grid
    • Split-Screen Cinematic Shot for Time Travel Comparison
    • YouTube Thumbnail Prompt: Political Split Screen
    • Youtube Thumbnail Concept: The New Weapon
    • Giant Pharmaceutical Capsule with White House Miniature
    • Text Analysis Prompt for Identifying Issues in a Pick-Up Line
    • Medical Infographic JSON Prompt
    • Style Transfer for Medical Term Infographic
    • Stylized Editorial Hybrid Composition
    • Comic from single image
    • Cinematic Character Bible Split Sheet
    • Photo to Watercolor Travel Split
    • Street Fashion Panther Graffiti
    • Graphic Design Poster Generator
    • Character Promotion Poster Framework
    • 3D Diorama of Comic Book Covers and Toys
    • US Citizenship Identity Card Mockup
    • Neon Ghost Night Portrait
    • Website Homepage Screenshot Generation
    • Tipsy Businessman on Marble Stairs

    Show more

    Run it on your phone

    1. Prompt copiedRead it

      { "type": "editorial infographic dual-axis line chart", "style": "clean, newspaper-style, off-white background, highly legible typography", "header": { "category": "CRIME, SAFETY & JUSTICE (red text with red square icon)", "headline": "{argument name=\"main headline\" default=\"Crime is down 50% since 1993. Most Americans think it's going up. Both true simultaneously.\"}", "sub_headline": "US VIOLENT CRIME RATE vs PUBLIC PERCEPTION · 1990-PRESENT · BJS/FBI + GALLUP" }, "chart": { "x_axis": "Years 1990 to 2024 with 8 tick marks", "left_y_axis": { "color": "blue", "label": "{argument name=\"left axis label\" default=\"VIOLENT CRIME RATE per 100,000 people\"}", "range": "200 to 800" }, "right_y_axis": { "color": "red", "label": "{argument name=\"right axis label\" default=\"% OF AMERICANS WHO SAY 'CRIME IS UP FROM LAST YEAR'\"}", "range": "20% to 80%" }, "data_series": [ { "name": "Reality", "style": "solid blue line", "trend": "peaks early then drops significantly", "annotations": [ "1993 PEAK 747 violent crimes per 100,000 (with blue dot)", "REALITY: Crime Has Fallen (with blue arrow pointing to line)", "2024 376 per 100,000 ~50% LOWER than 1993 (with blue dot)" ] }, { "name": "Public Perception", "style": "dashed red line", "trend": "remains relatively flat and high", "annotations": [ "PUBLIC PERCEPTION: Remains High... (with red arrow pointing to line)", "2024 62% think crime is up (with red dot)" ] } ] }, "callout_box": { "position": "bottom left inside chart area", "style": "light yellow rectangle", "icon": "lightbulb", "text": "{argument name=\"callout text\" default=\"The crime rate and the public's feeling about crime have almost no relationship.\"}" }, "footer": { "text": "SOURCE: {argument name=\"footer source\" default=\"Bureau of Justice Statistics NCVS · FBI Uniform Crime Reports · Gallup Crime Poll\"}" } }

    2. Open your app

      This prompt is long, so it is copied instead of sent in the link. Paste it in the app.

    3. Paste and run

      Press and hold the message box, then tap Paste. Add your photo first if the prompt uses one. You may need to sign in.

    Editorial Dual-Axis Data Infographic