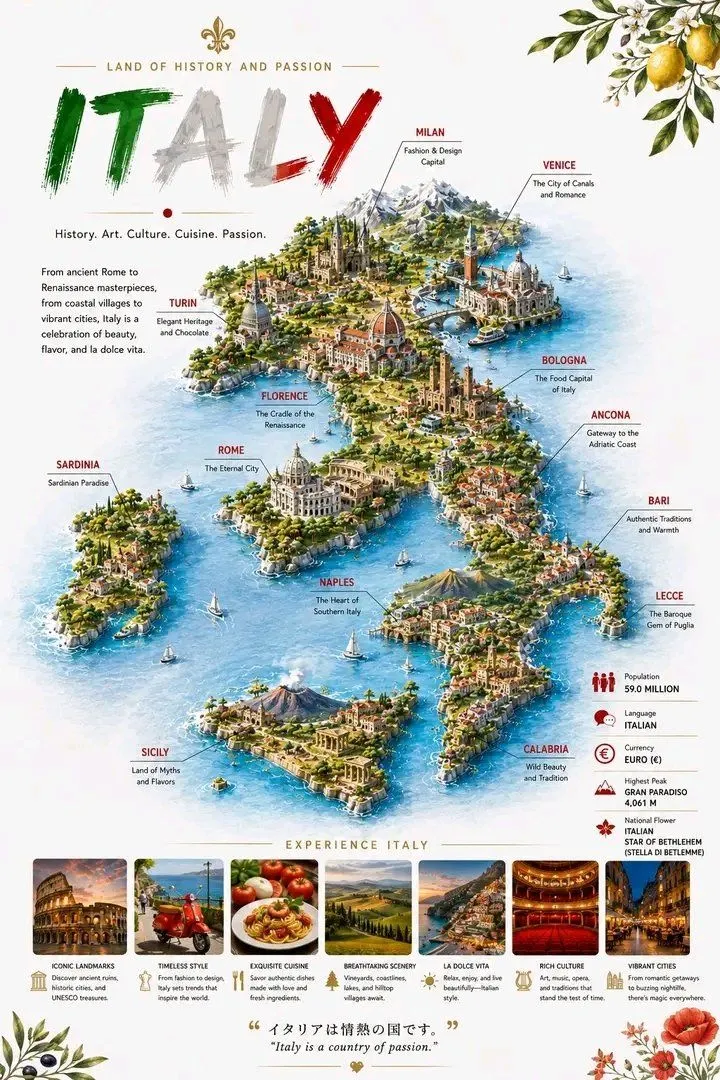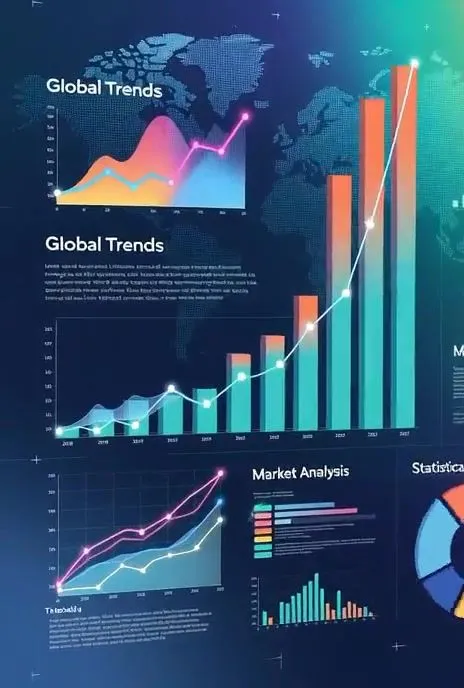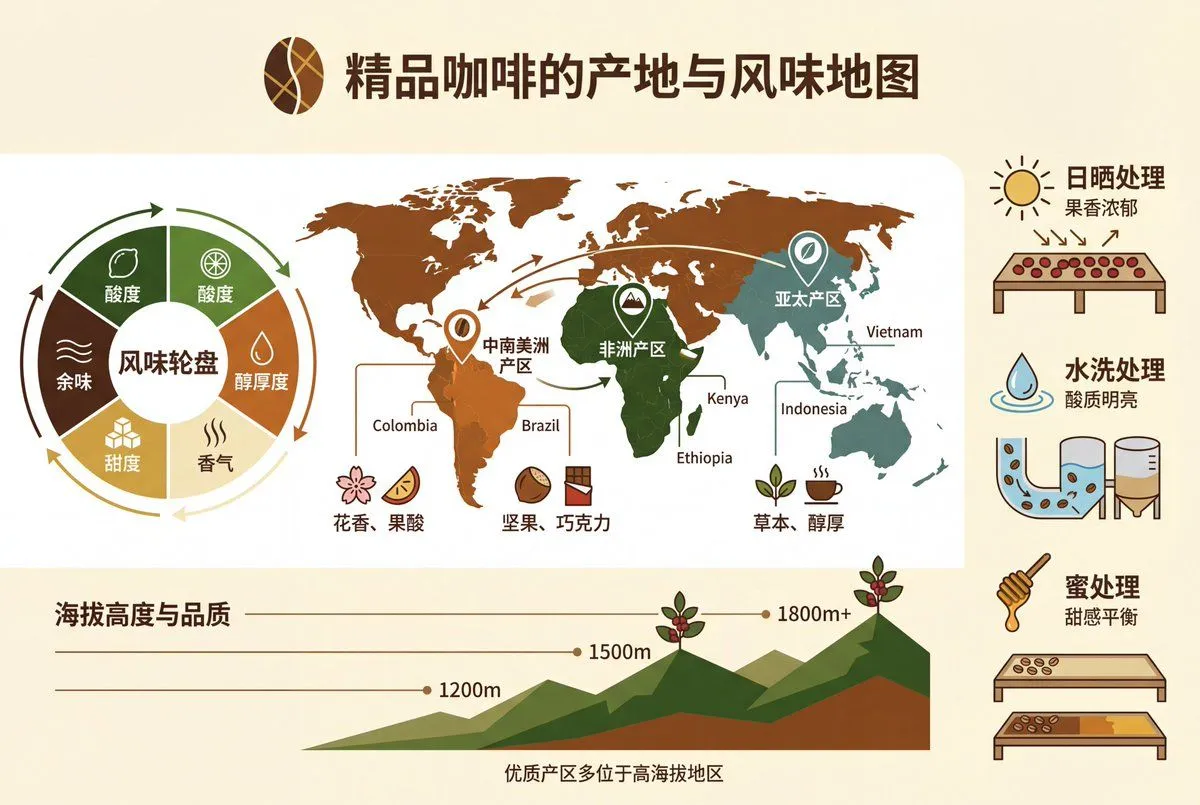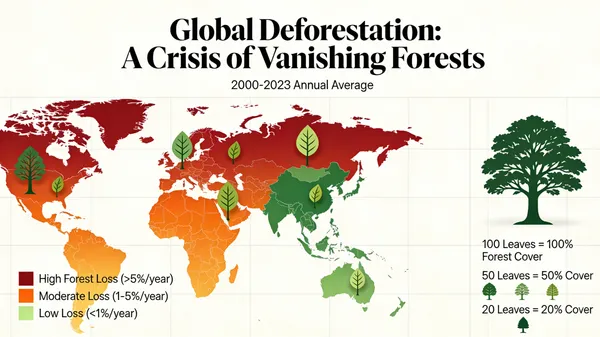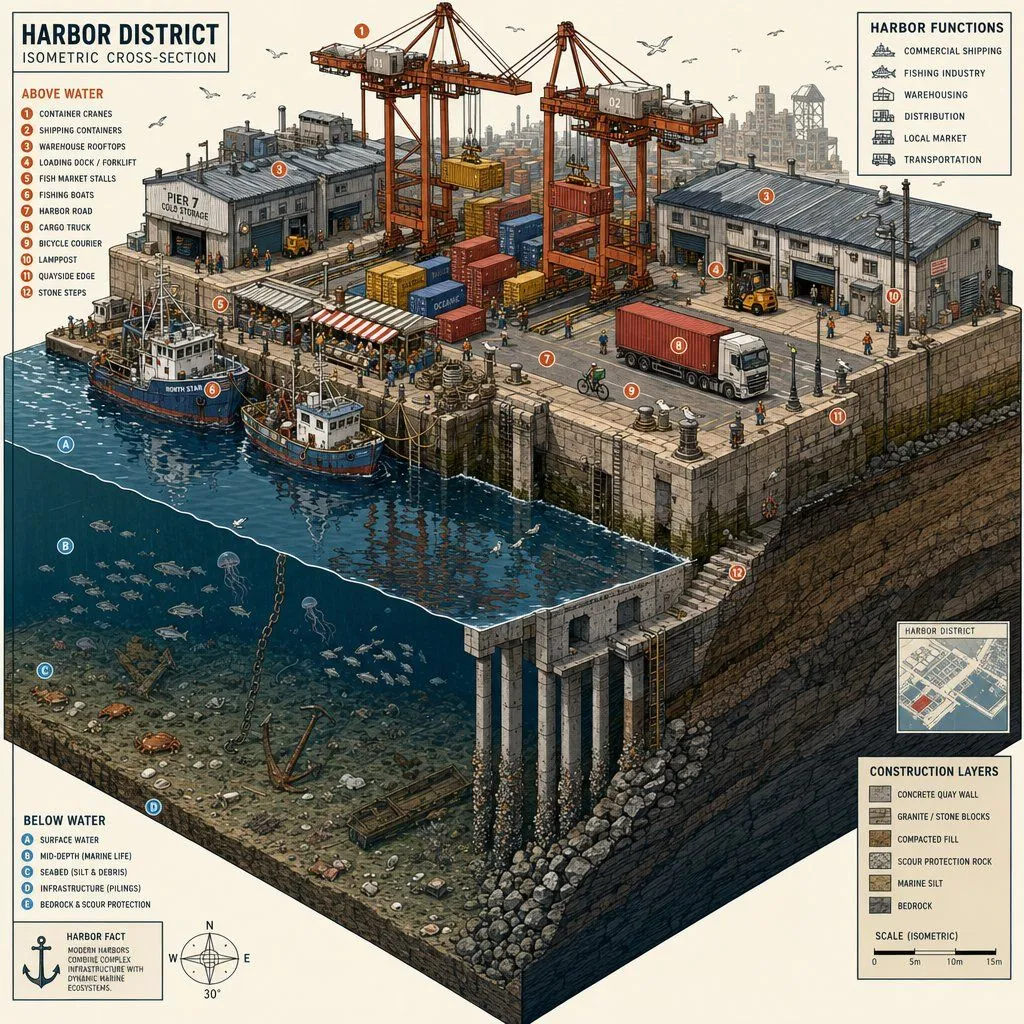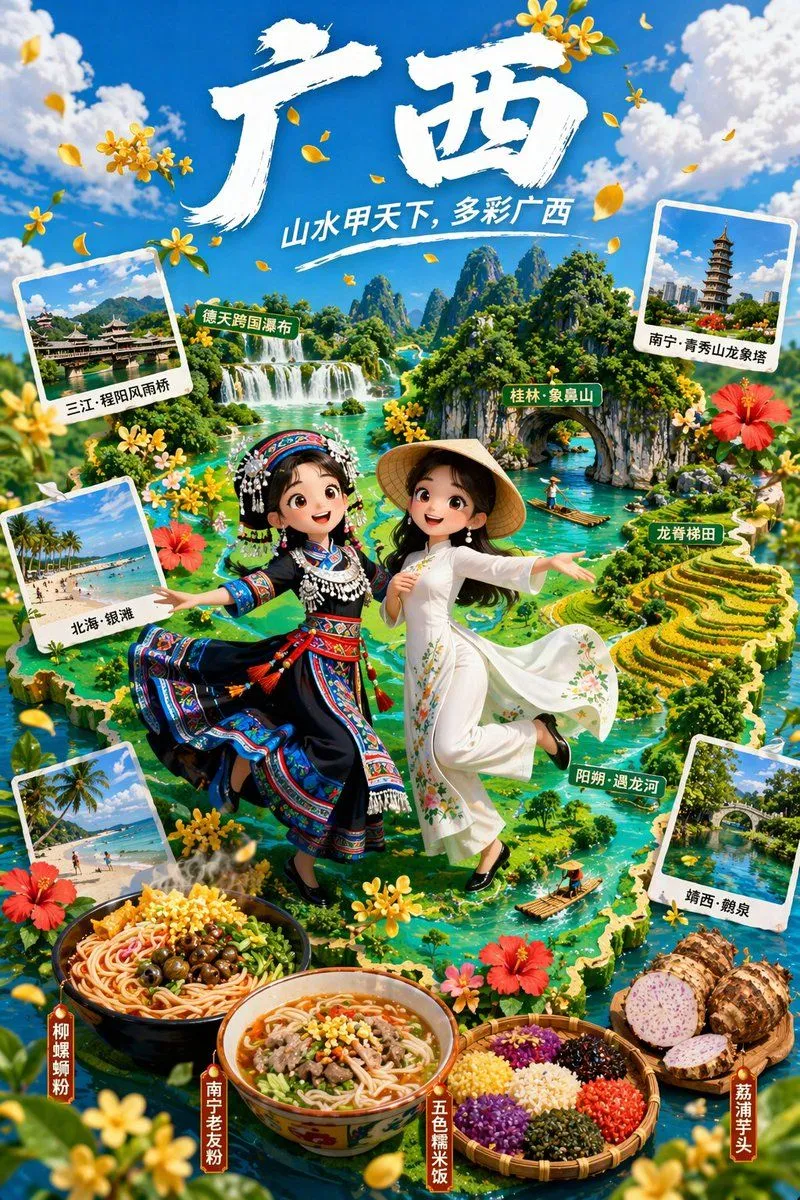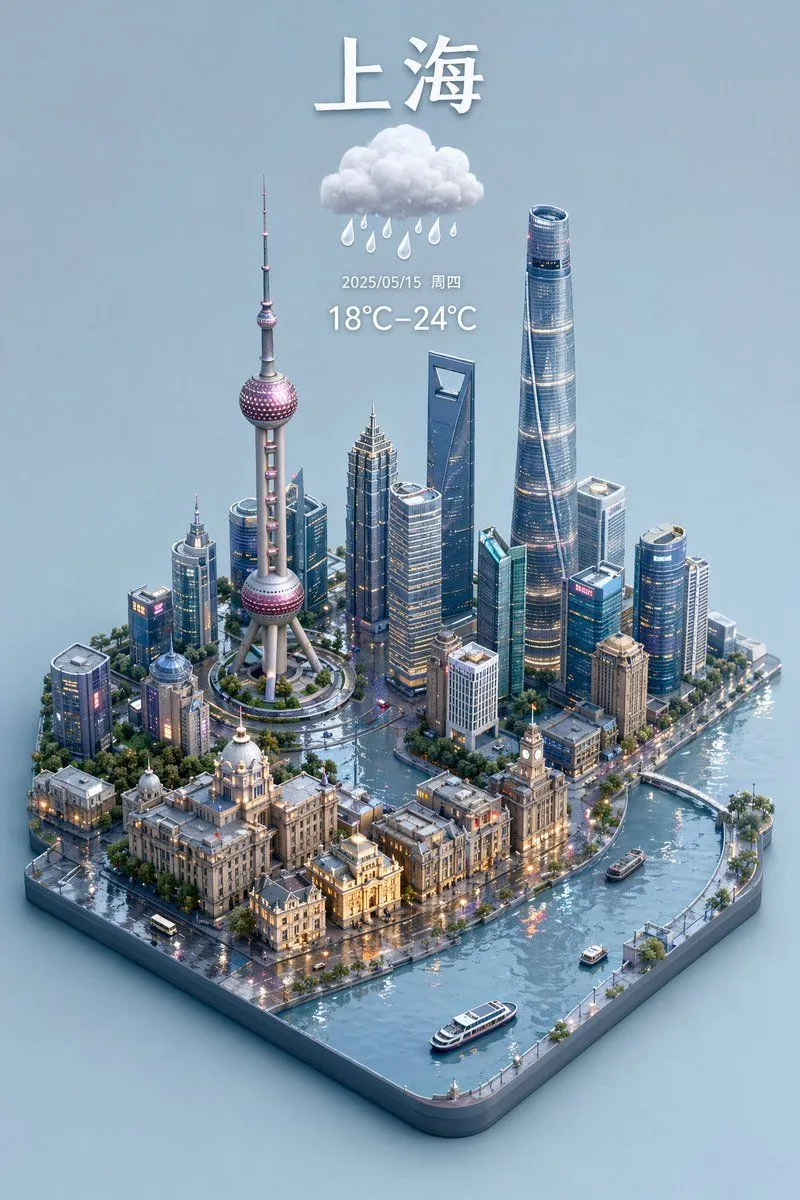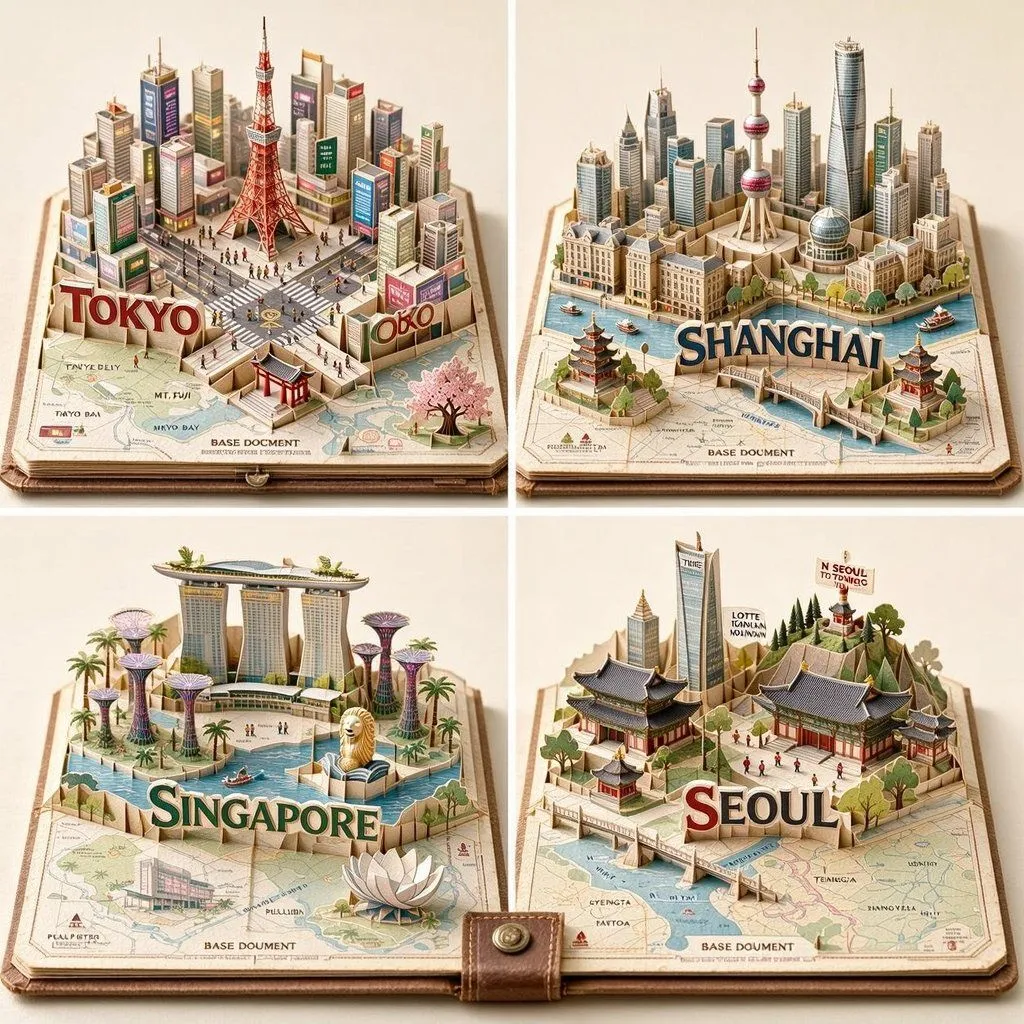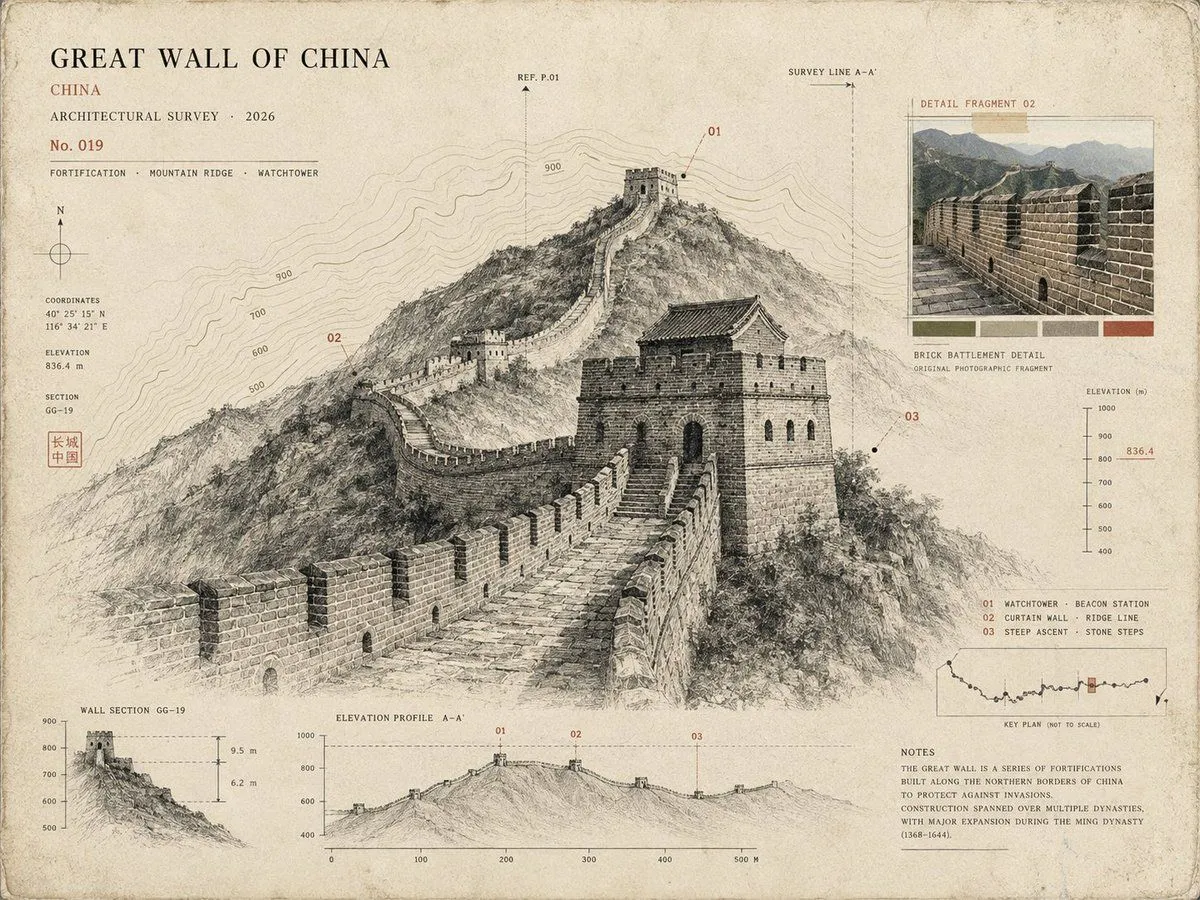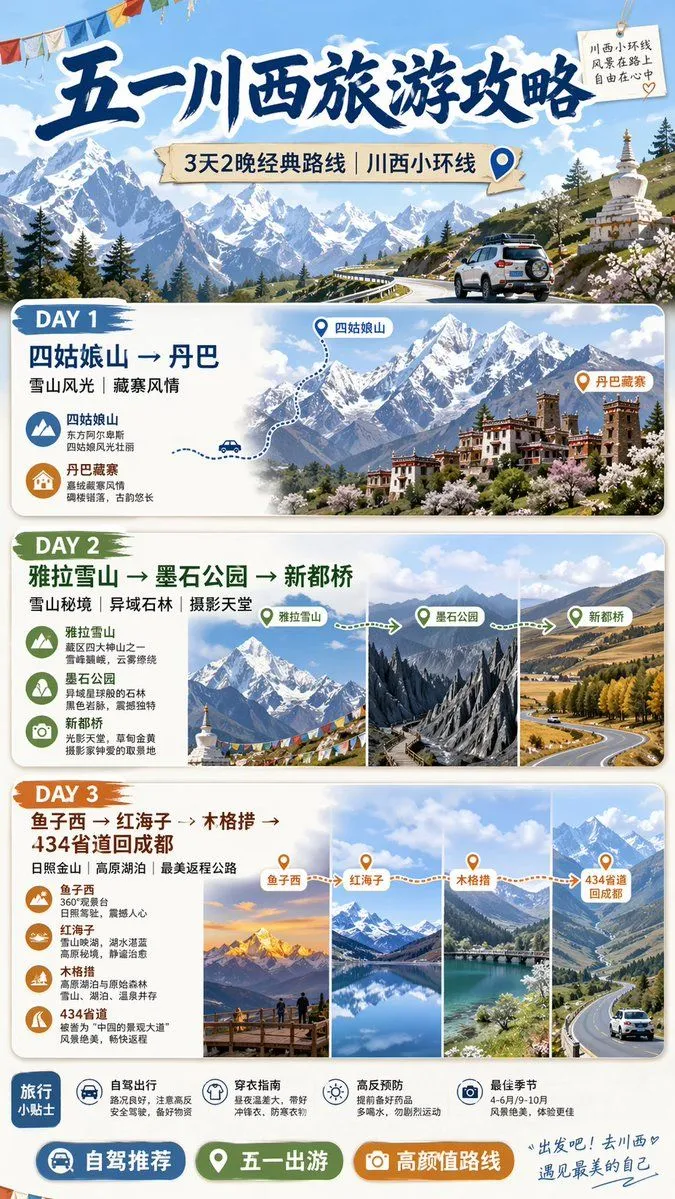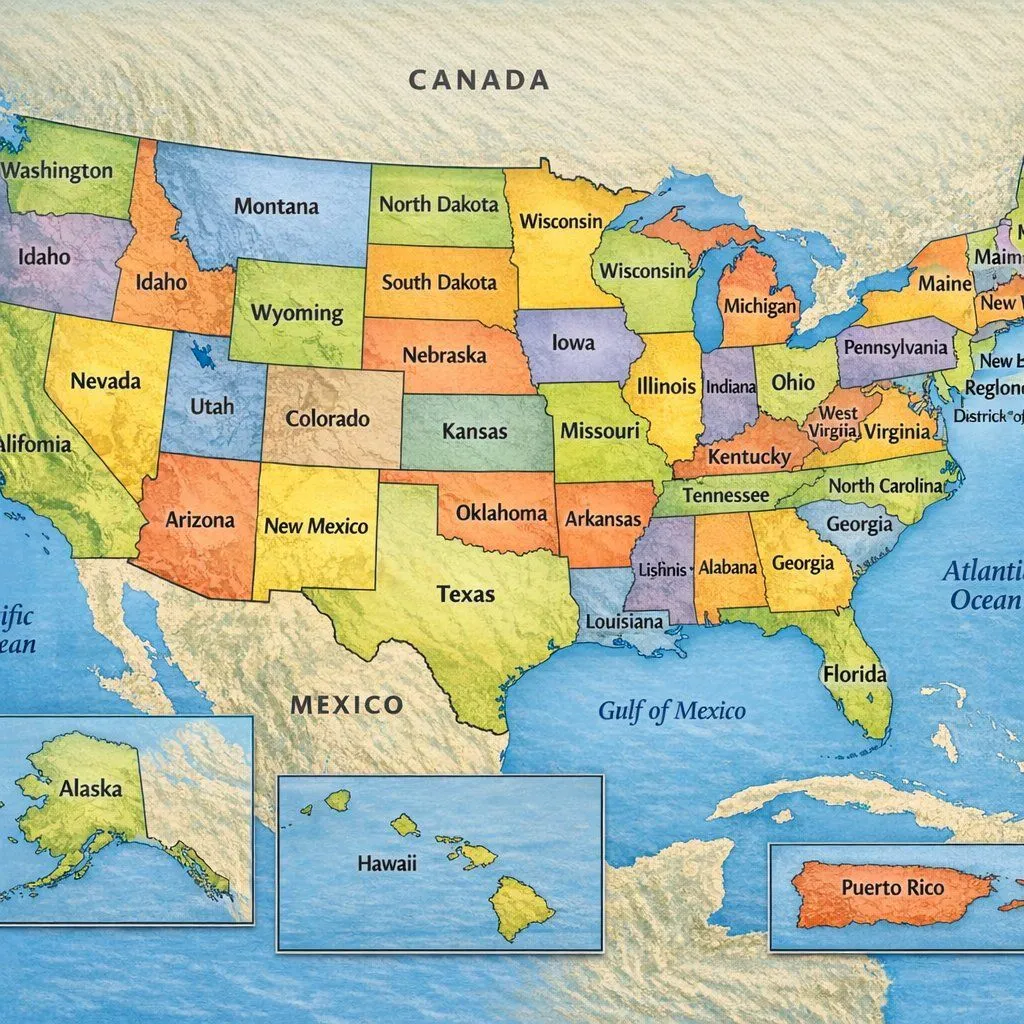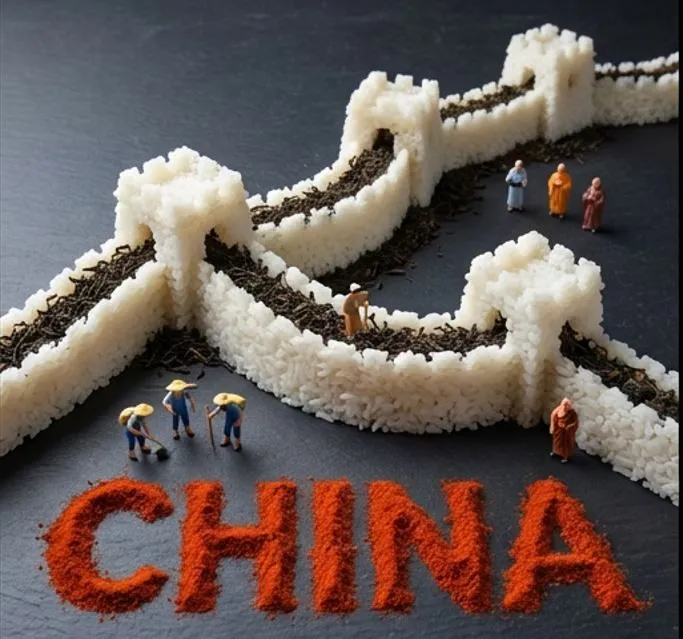

Made with GPT Image 2 in ChatGPT by Library Explainers. Promptclay never generates images.
Did it work?
No reports yet. Tell others if it worked for you.
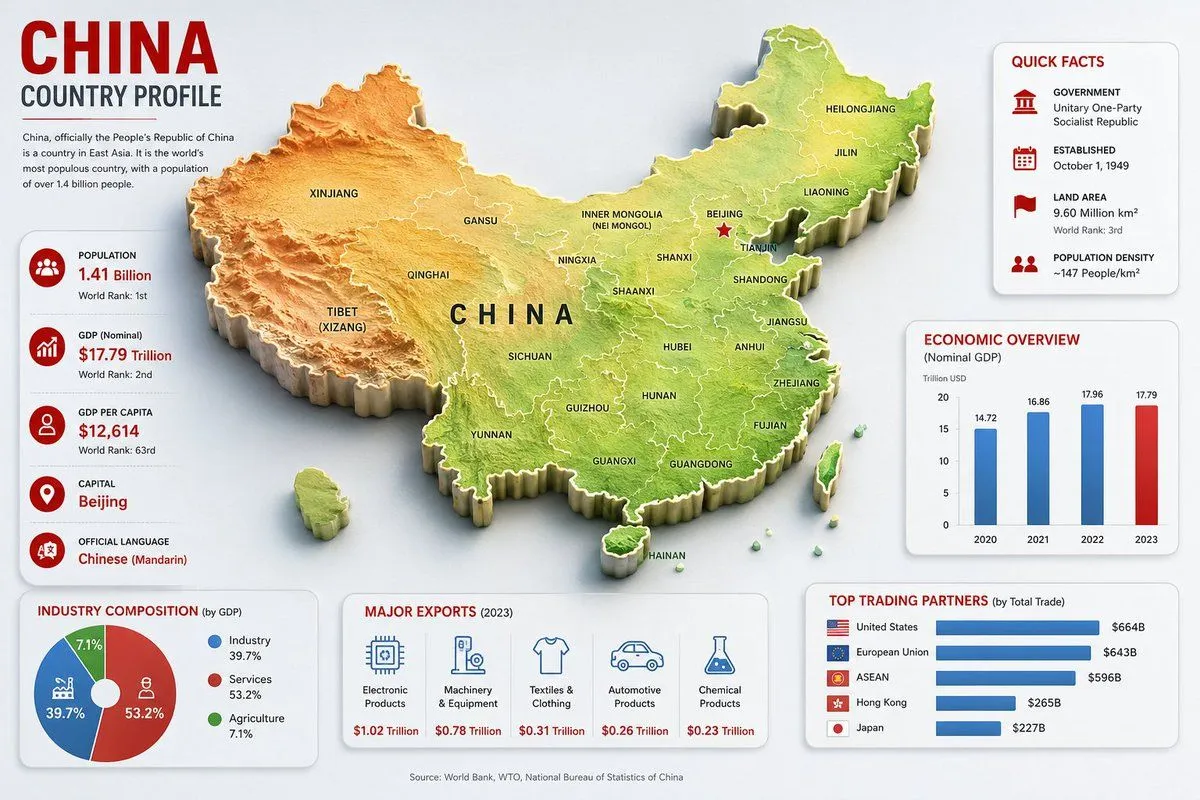
China Country Profile Infographic
Prompt
4 blanks to fillGoal: Create a clean, modern country-profile infographic for {country_name}, titled “CHINA COUNTRY PROFILE,” with a large central 3D raised relief map and surrounding statistical cards. Canvas: 16:9 horizontal infographic, light gray background, crisp corporate editorial style, subtle shadows, red/blue/green accent colors, high-resolution vector-meets-3D look. Main map: Place a large raised 3D topographic map of China in the center, occupying most of the canvas. Use terrain coloring: orange-brown mountains in the west, yellow central plateau, green eastern lowlands and coast. Add white province borders and black province labels. Include Taiwan, Hainan, and small South China Sea islands as separate raised pieces. Put large spaced black letters “CHINA” across the center. Mark Beijing with a red star and label it. Visible map labels should include exactly 28 province/region/city labels: Xinjiang, Tibet (Xizang), Qinghai, Gansu, Inner Mongolia (Nei Mongol), Ningxia, Sichuan, Yunnan, Guizhou, Guangxi, Guangdong, Hainan, Fujian, Zhejiang, Jiangsu, Anhui, Shandong, Hubei, Hunan, Shaanxi, Shanxi, Beijing, Tianjin, Liaoning, Jilin, Heilongjiang, Taiwan, and China. Top-left title block: Big red headline “CHINA,” dark subtitle “COUNTRY PROFILE,” a thin red divider line, and a short paragraph: “China, officially the People’s Republic of China is a country in East Asia. It is the world’s most populous country, with a population of over 1.4 billion people.” Left statistics card: A tall rounded white card with exactly 5 stacked fact rows, each with a red circular icon and text. The 5 rows are: Population — {population_value} — World Rank: 1st; GDP (Nominal) — $17.79 Trillion — World Rank: 2nd; GDP Per Capita — $12,614 — World Rank: 63rd; Capital — {capital_city}; Official Language — {official_language}. Use thin separators between rows. Top-right quick facts card: A rounded white card titled “QUICK FACTS” in red. Include exactly 4 rows with red icons: Government — Unitary One-Party Socialist Republic; Established — October 1, 1949; Land Area — 9.60 Million km², World Rank: 3rd; Population Density — ~147 People/km². Middle-right economic chart card: A rounded white card titled “ECONOMIC OVERVIEW” with subtitle “(Nominal GDP)” and small label “Trillion USD.” Include exactly 4 vertical bars for 2020, 2021, 2022, 2023 with values 14.72, 16.86, 17.96, 17.79. Use blue bars for 2020–2022 and a red bar for 2023. Bottom-left industry card: A rounded white card titled “INDUSTRY COMPOSITION (by GDP).” Include exactly 3-part donut chart segments: Industry 39.7% in blue, Services 53.2% in red, Agriculture 7.1% in green. Add matching legend with the same 3 labels and percentages. Bottom-center exports card: A rounded white card titled “MAJOR EXPORTS (2023).” Include exactly 5 export columns with blue line icons and red values: Electronic Products — $1.02 Trillion; Machinery & Equipment — $0.78 Trillion; Textiles & Clothing — $0.31 Trillion; Automotive Products — $0.26 Trillion; Chemical Products — $0.23 Trillion. Bottom-right trading partners card: A rounded white card titled “TOP TRADING PARTNERS (by Total Trade).” Include exactly 5 horizontal blue bars with small flag icons and values: United States — $664B; European Union — $643B; ASEAN — $596B; Hong Kong — $265B; Japan — $227B. Footer: Center a small source line reading “Source: World Bank, WTO, National Bureau of Statistics of China.” Constraints: Keep all cards aligned around the map without overlapping it, use consistent typography, red headings, blue chart elements, subtle drop shadows, rounded card corners, and no watermark.
Preview of your prompt
Goal: Create a clean, modern country-profile infographic for China, titled “CHINA COUNTRY PROFILE,” with a large central 3D raised relief map and surrounding statistical cards. Canvas: 16:9 horizontal infographic, light gray background, crisp corporate editorial style, subtle shadows, red/blue/green accent colors, high-resolution vector-meets-3D look. Main map: Place a large raised 3D topographic map of China in the center, occupying most of the canvas. Use terrain coloring: orange-brown mountains in the west, yellow central plateau, green eastern lowlands and coast. Add white province borders and black province labels. Include Taiwan, Hainan, and small South China Sea islands as separate raised pieces. Put large spaced black letters “CHINA” across the center. Mark Beijing with a red star and label it. Visible map labels should include exactly 28 province/region/city labels: Xinjiang, Tibet (Xizang), Qinghai, Gansu, Inner Mongolia (Nei Mongol), Ningxia, Sichuan, Yunnan, Guizhou, Guangxi, Guangdong, Hainan, Fujian, Zhejiang, Jiangsu, Anhui, Shandong, Hubei, Hunan, Shaanxi, Shanxi, Beijing, Tianjin, Liaoning, Jilin, Heilongjiang, Taiwan, and China. Top-left title block: Big red headline “CHINA,” dark subtitle “COUNTRY PROFILE,” a thin red divider line, and a short paragraph: “China, officially the People’s Republic of China is a country in East Asia. It is the world’s most populous country, with a population of over 1.4 billion people.” Left statistics card: A tall rounded white card with exactly 5 stacked fact rows, each with a red circular icon and text. The 5 rows are: Population — 1.41 Billion — World Rank: 1st; GDP (Nominal) — $17.79 Trillion — World Rank: 2nd; GDP Per Capita — $12,614 — World Rank: 63rd; Capital — Beijing; Official Language — Chinese (Mandarin). Use thin separators between rows. Top-right quick facts card: A rounded white card titled “QUICK FACTS” in red. Include exactly 4 rows with red icons: Government — Unitary One-Party Socialist Republic; Established — October 1, 1949; Land Area — 9.60 Million km², World Rank: 3rd; Population Density — ~147 People/km². Middle-right economic chart card: A rounded white card titled “ECONOMIC OVERVIEW” with subtitle “(Nominal GDP)” and small label “Trillion USD.” Include exactly 4 vertical bars for 2020, 2021, 2022, 2023 with values 14.72, 16.86, 17.96, 17.79. Use blue bars for 2020–2022 and a red bar for 2023. Bottom-left industry card: A rounded white card titled “INDUSTRY COMPOSITION (by GDP).” Include exactly 3-part donut chart segments: Industry 39.7% in blue, Services 53.2% in red, Agriculture 7.1% in green. Add matching legend with the same 3 labels and percentages. Bottom-center exports card: A rounded white card titled “MAJOR EXPORTS (2023).” Include exactly 5 export columns with blue line icons and red values: Electronic Products — $1.02 Trillion; Machinery & Equipment — $0.78 Trillion; Textiles & Clothing — $0.31 Trillion; Automotive Products — $0.26 Trillion; Chemical Products — $0.23 Trillion. Bottom-right trading partners card: A rounded white card titled “TOP TRADING PARTNERS (by Total Trade).” Include exactly 5 horizontal blue bars with small flag icons and values: United States — $664B; European Union — $643B; ASEAN — $596B; Hong Kong — $265B; Japan — $227B. Footer: Center a small source line reading “Source: World Bank, WTO, National Bureau of Statistics of China.” Constraints: Keep all cards aligned around the map without overlapping it, use consistent typography, red headings, blue chart elements, subtle drop shadows, rounded card corners, and no watermark.
DetailsVersions, settings and questions
Written for
What's in the prompt
- Subject
- Model
- GPT Image 2
If your face changes
keep my face exactly the sameQuestions
- Does this work in the ChatGPT app?
- Yes. Paste the prompt and attach your photo if it uses one.
- It changed my face. What do I do?
- Add "keep my face exactly the same" to the end and run it again.
- Can I use the images I make?
- Check the terms of the app you use. Promptclay never generates images and claims nothing you make.